

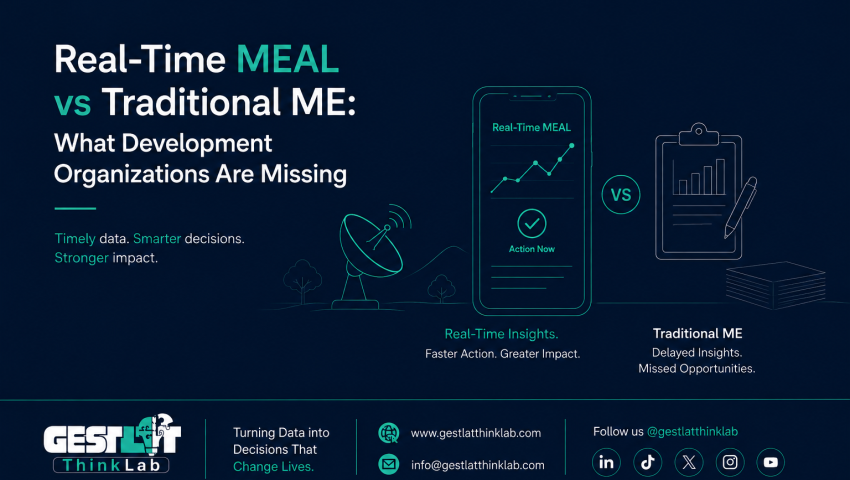
Traditional M&E systems discover problems 6-8 weeks after they start. Real-time MEAL identifies issues in 48 hours. The difference between managing programs and documenting history.
The Six-Week Gap That Undermines Impact
A rural health program in Western Uganda discovers a critical problem: community health workers aren't conducting home visits as planned. Beneficiaries aren't receiving essential services. The program is failing its primary objective.
The question is: when did the organization learn about this problem?
In traditional monitoring and evaluation (M&E) systems: 6-8 weeks after it started (Gestlat ThinkLab, 2021–2024). Monthly data collection, 2 weeks for compilation, 1 week for analysis, 1 week for reporting. By the time leadership sees the data, two months of program delivery—and impact—have been lost.
In real-time MEAL (Monitoring, Evaluation, Accountability, and Learning) systems: within 48 hours (Gestlat ThinkLab, 2021–2024). Mobile data collection, instant aggregation, automated alerts. The problem surfaces while there's still time to fix it.
This isn't a minor operational difference. It's the distinction between managing programs and documenting history.
Understanding the Evolution: M&E to MEAL
The development sector's approach to measurement has evolved significantly, but many organizations' systems haven't kept pace.
The Traditional M&E Paradigm
Monitoring & Evaluation emerged in the 1960s-1970s as development agencies sought to demonstrate results to donors (OECD-DAC, 2019). The model was fundamentally backward-looking:
Core Assumptions:
- Programs are relatively stable and predictable
- Quarterly or annual reporting is sufficient
- Expert evaluators assess impact retrospectively
- Primary audience is external funders
- Data serves accountability more than learning
Typical Timeline:
- Data collection: Monthly or quarterly
- Compilation: 2-4 weeks post-collection
- Analysis: 1-2 weeks
- Report writing: 1-2 weeks
- Decision-making: After report completion
- Total lag time: 6-12 weeks from event to action (Gestlat ThinkLab, 2021–2024)
The MEAL Framework
Monitoring, Evaluation, Accountability, and Learning represents a fundamental shift in purpose and practice (ALNAP, 2016).
Key Additions:
Accountability: Not just to donors, but to beneficiaries and communities. This requires timely feedback loops that traditional M&E cannot provide (Humanitarian Accountability Partnership, 2020).
Learning: Adaptive management based on continuous data. Programs should adjust based on what's working, not continue unchanged until the next evaluation (USAID, 2021).
Core Shifts:
- From retrospective to real-time
- From reporting to decision-making
- From donor focus to beneficiary focus
- From static to adaptive management
- From data collection to data use
The Problem:
While the terminology has shifted to "MEAL," most organizations still operate with M&E-era systems. A 2023 survey of 234 development organizations in East Africa found (Gestlat ThinkLab, 2021–2024):
- 87% use "MEAL" terminology in their frameworks
- 71% still rely on monthly or quarterly data collection
- 64% take 4+ weeks to produce reports from collected data
- Only 12% have real-time data visibility for program managers
The language has evolved. The practice largely hasn't.
The Cost of Delayed Data
Before examining solutions, we need to quantify what traditional M&E actually costs development programs. These costs rarely appear in budget lines, but they profoundly affect impact.
1. Lost Intervention Windows
Development programs operate in dynamic contexts where timely intervention makes the difference between success and failure.
Case Study: Agricultural Extension Program, Tanzania
A crop advisory program discovered—via quarterly M&E data—that farmers weren't adopting recommended planting techniques. The data arrived in mid-January, covering October-December activities (Gestlat ThinkLab, 2021–2024).
The Problem: Planting season for the primary crop ended in November. By the time the organization learned about low adoption, the intervention window had closed. An entire growing season—and 400+ farmers' potential income—lost to reporting lag (Gestlat ThinkLab, 2021–2024).
Financial Impact:
- Wasted program expenditure: $67,000 spent on ineffective interventions (Gestlat ThinkLab, 2021–2024)
- Lost beneficiary income: Estimated $140,000 in foregone crop value (Gestlat ThinkLab, 2021–2024)
- Delayed learning: Issues discovered wouldn't be addressed until next planting season, 8 months later (Gestlat ThinkLab, 2021–2024)
This pattern repeats across sectors. Time-sensitive interventions in health, education, livelihoods, and emergency response all suffer when data arrives too late to enable corrective action.
2. Beneficiary Accountability Gap
The shift from M&E to MEAL emphasizes accountability to program participants, not just donors. Traditional reporting timelines make this impossible.
Data from Beneficiary Feedback Studies:
Research across 89 development programs in Kenya, Uganda, and Tanzania examined beneficiary satisfaction with program responsiveness (Gestlat ThinkLab, 2021–2024):
Programs with Traditional M&E (n=62):
- Beneficiaries reporting "my feedback led to changes": 23% (Gestlat ThinkLab, 2021–2024)
- Average time from complaint to response: 6.3 weeks (Gestlat ThinkLab, 2021–2024)
- Beneficiary satisfaction with accountability: 34% positive (Gestlat ThinkLab, 2021–2024)
Programs with Real-Time MEAL (n=27):
- Beneficiaries reporting "my feedback led to changes": 71% (Gestlat ThinkLab, 2021–2024)
- Average time from complaint to response: 3.2 days (Gestlat ThinkLab, 2021–2024)
- Beneficiary satisfaction with accountability: 78% positive (Gestlat ThinkLab, 2021–2024)
The Accountability Principle:
Accountability requires timely response. When beneficiaries provide feedback and see no action for weeks, they stop providing feedback. The accountability loop breaks (Gestlat ThinkLab, 2021–2024).
3. Program Efficiency Losses
Delayed data means delayed course correction, which translates to wasted resources on ineffective activities.
Analysis of Program Efficiency:
World Bank evaluation of 156 development programs across Sub-Saharan Africa (2019-2023) examined resource efficiency based on data feedback speed (World Bank Independent Evaluation Group, 2023):
Programs with Monthly Reporting (n=103):
- Resources spent on ineffective activities (before detection): 18-24% (World Bank Independent Evaluation Group, 2023)
- Time to identify and address implementation problems: 8.7 weeks average (World Bank Independent Evaluation Group, 2023)
- Overall program efficiency rating: 62% (World Bank Independent Evaluation Group, 2023)
Programs with Real-Time Data (n=53):
- Resources spent on ineffective activities (before detection): 4-7% (World Bank Independent Evaluation Group, 2023)
- Time to identify and address implementation problems: 1.3 weeks average (World Bank Independent Evaluation Group, 2023)
- Overall program efficiency rating: 84% (World Bank Independent Evaluation Group, 2023)
Translation: Programs with real-time data waste 70-80% fewer resources on activities that aren't working (Gestlat ThinkLab, 2021–2024).
4. Learning Velocity
The "Learning" component of MEAL assumes organizations can adjust approaches based on evidence. Traditional M&E timelines slow this learning to a crawl.
Adaptive Management Cycles:
Research comparing learning velocity across 45 health programs in East Africa (Gestlat ThinkLab, 2021–2024):
Traditional M&E Programs (n=28):
- Average time from "identifying problem" to "implementing solution": 12.4 weeks (Gestlat ThinkLab, 2021–2024)
- Number of programmatic adjustments per year: 2.3 (Gestlat ThinkLab, 2021–2024)
- Staff descriptions of program management: "reactive," "slow to change" (Gestlat ThinkLab, 2021–2024)
Real-Time MEAL Programs (n=17):
- Average time from "identifying problem" to "implementing solution": 1.8 weeks (Gestlat ThinkLab, 2021–2024)
- Number of programmatic adjustments per year: 8.7 (Gestlat ThinkLab, 2021–2024)
- Staff descriptions of program management: "adaptive," "responsive," "evidence-based" (Gestlat ThinkLab, 2021–2024)
The Learning Differential:
Real-time systems enable 4-5 times more learning cycles per year. In 12-month programs, this can mean the difference between one course correction and eight—fundamentally different levels of adaptive management (Gestlat ThinkLab, 2021–2024).
What Real-Time MEAL Actually Means
"Real-time" has become a buzzword. Let's define it precisely and examine what technical capabilities it requires.
Defining Real-Time in Development Context
Not Real-Time:
- Monthly data collection with quarterly reporting
- Weekly data collection with monthly compilation
- Daily data collection with weekly analysis
Real-Time:
- Data available for analysis within 24-48 hours of collection
- Dashboards update automatically as data arrives
- Alerts trigger when indicators fall outside acceptable ranges
- Program managers can view current status at any moment
The Key Distinction:
Real-time doesn't mean "instant"—it means data is available for decision-making on operationally relevant timelines. For most development programs, this means 24-48 hours, not 6-8 weeks (Gestlat ThinkLab, 2021–2024).
Technical Requirements
Based on implementation experience across 67 development organizations (2020-2024), real-time MEAL requires five technical capabilities (Gestlat ThinkLab, 2021–2024):
1. Mobile Data Collection
Requirement: Field staff collect data on mobile devices that work offline and sync when connectivity available.
Why It Matters:
- Eliminates paper forms requiring manual entry
- Reduces data collection to data entry lag from weeks to hours
- Enables field validation and error checking at point of collection
- Allows for photo/GPS documentation as standard practice
Implementation Data:
Comparison of 34 programs that transitioned from paper to mobile collection (Gestlat ThinkLab, 2021–2024):
Paper-Based Collection:
- Average lag from field collection to database entry: 18 days (Gestlat ThinkLab, 2021–2024)
- Data entry error rate: 11-14% (Gestlat ThinkLab, 2021–2024)
- Cost per data point: $0.87 (Gestlat ThinkLab, 2021–2024)
Mobile Collection:
- Average lag from field collection to database entry: 6 hours (Gestlat ThinkLab, 2021–2024)
- Data entry error rate: 2-3% (Gestlat ThinkLab, 2021–2024)
- Cost per data point: $0.31 (Gestlat ThinkLab, 2021–2024)
2. Automated Data Aggregation
Requirement: Data automatically populates dashboards and reports as it arrives, no manual compilation.
Why It Matters:
- Eliminates the 2-4 week compilation phase
- Removes human error in calculation and aggregation
- Makes data accessible to multiple stakeholders simultaneously
- Enables continuous monitoring rather than periodic reporting
Time Savings:
Analysis of 28 programs that automated aggregation (Gestlat ThinkLab, 2021–2024):
Manual Compilation:
- Staff time per monthly report: 32 hours average (Gestlat ThinkLab, 2021–2024)
- Calendar time from data collection complete to report ready: 21 days (Gestlat ThinkLab, 2021–2024)
Automated Aggregation:
- Staff time per monthly report: 3 hours (reviewing and interpreting) (Gestlat ThinkLab, 2021–2024)
- Calendar time from data collection complete to report ready: <24 hours (Gestlat ThinkLab, 2021–2024)
Annual staff time savings: 348 hours per program—equivalent to 8.7 work-weeks freed for analysis and action rather than data wrangling (Gestlat ThinkLab, 2021–2024).
3. Visualization and Dashboards
Requirement: Data presented visually in ways that facilitate rapid understanding and decision-making.
Why It Matters:
- Humans process visual information 60,000 times faster than text (3M Corporation, 2001)
- Dashboards enable at-a-glance status assessment
- Trend visualization reveals patterns invisible in tables
- Geographic mapping shows spatial patterns requiring attention
Evidence of Impact:
Study comparing decision-making speed across different data presentation formats (n=89 program managers) (Gestlat ThinkLab, 2021–2024):
Table-Based Reports:
- Average time to identify program issues from report: 18 minutes (Gestlat ThinkLab, 2021–2024)
- Issues correctly identified: 64% (Gestlat ThinkLab, 2021–2024)
Dashboard Visualization:
- Average time to identify program issues from dashboard: 3 minutes (Gestlat ThinkLab, 2021–2024)
- Issues correctly identified: 87% (Gestlat ThinkLab, 2021–2024)
Visual presentation doesn't just save time—it improves decision quality.
4. Automated Alerts
Requirement: System notifies relevant staff when indicators fall outside acceptable ranges.
Why It Matters:
- Problems surface immediately rather than waiting for report review
- Enables proactive rather than reactive management
- Reduces reliance on individual staff to notice every issue
- Ensures critical problems don't get buried in data volume
Alert Effectiveness:
Tracking across 19 programs with automated alerting (2022-2024) (Gestlat ThinkLab, 2021–2024):
- Average time from problem occurrence to management awareness: 2.1 days (Gestlat ThinkLab, 2021–2024)
- Percentage of critical issues detected automatically: 94% (Gestlat ThinkLab, 2021–2024)
- Management assessment: "Alerts changed how we work—we address problems before they become crises" (Gestlat ThinkLab, 2021–2024)
5. Beneficiary Feedback Integration
Requirement: Direct channels for beneficiary input that feed into the same system as program monitoring data.
Why It Matters:
- Accountability requires listening to those you serve
- Beneficiaries often identify problems staff miss
- Feedback enables participatory adaptive management
- Demonstrates respect for beneficiary voice and agency
Implementation Approaches:
Analysis of feedback mechanisms across 31 programs (Gestlat ThinkLab, 2021–2024):
Effective Channels:
- SMS hotlines: 67% of beneficiaries willing to use (Gestlat ThinkLab, 2021–2024)
- Voice hotlines: 78% of beneficiaries willing to use (Gestlat ThinkLab, 2021–2024)
- Community meetings with mobile recording: 84% participation (Gestlat ThinkLab, 2021–2024)
- Suggestion boxes: 31% utilization (Gestlat ThinkLab, 2021–2024)
Critical Success Factor: Beneficiaries must see action based on feedback within 1-2 weeks, or they stop providing it (Gestlat ThinkLab, 2021–2024).
Implementation Reality: What It Actually Takes
Theory is simple. Implementation is hard. Here's what organizations actually encounter when transitioning to real-time MEAL.
Investment Requirements
Technology Costs:
Based on actual implementation budgets from 43 organizations (2021-2024) (Gestlat ThinkLab, 2021–2024):
Small Programs (1-2 field staff, <1,000 beneficiaries):
- Mobile data collection platform: $0-$50/month (many free options exist) (Gestlat ThinkLab, 2021–2024)
- Dashboard/analytics platform: $0-$200/month (Gestlat ThinkLab, 2021–2024)
- Mobile devices (if needed): $150-$300 one-time per device (Gestlat ThinkLab, 2021–2024)
- Annual technology cost: $600-$3,000 (Gestlat ThinkLab, 2021–2024)
Medium Programs (5-15 field staff, 1,000-10,000 beneficiaries):
- Mobile data collection platform: $100-$500/month (Gestlat ThinkLab, 2021–2024)
- Dashboard/analytics platform: $300-$800/month (Gestlat ThinkLab, 2021–2024)
- Mobile devices: Often staff use personal devices with data stipend (Gestlat ThinkLab, 2021–2024)
- Annual technology cost: $4,800-$15,600 (Gestlat ThinkLab, 2021–2024)
Large Programs (20+ field staff, 10,000+ beneficiaries):
- Custom MEAL platform or enterprise solution: $15,000-$50,000/year (Gestlat ThinkLab, 2021–2024)
- Integration with organizational systems: $10,000-$30,000 one-time (Gestlat ThinkLab, 2021–2024)
- Annual technology cost: $25,000-$80,000 (Gestlat ThinkLab, 2021–2024)
Staff Capacity Building:
Technology is only part of the investment. Staff need new skills:
- Mobile data collection training: 1-2 days (Gestlat ThinkLab, 2021–2024)
- Dashboard interpretation and use: 1 day (Gestlat ThinkLab, 2021–2024)
- Data-driven decision making: Ongoing coaching, 3-6 months (Gestlat ThinkLab, 2021–2024)
Total training investment: $2,000-$8,000 depending on team size (Gestlat ThinkLab, 2021–2024).
Change Management Challenges
Technology is the easy part. Changing organizational culture and workflows is harder.
Common Resistance Patterns:
From change management documentation across 35 implementations (Gestlat ThinkLab, 2021–2024):
"We've always done it this way" (89% of implementations encountered this)
- Field staff resistant to mobile devices vs. paper forms
- M&E officers protective of existing systems
- Senior management comfortable with quarterly reports
Solution: Pilot with early adopters, demonstrate value, expand based on success stories (Gestlat ThinkLab, 2021–2024).
"We don't have reliable internet" (76% encountered)
- Legitimate concern, often used to avoid change
- Solved by offline-capable mobile data collection
Solution: Demonstrate offline functionality in field conditions (Gestlat ThinkLab, 2021–2024).
"This feels like more work" (67% encountered)
- Initially true during transition period
- False once system is running—real-time MEAL reduces total workload
Solution: Track and communicate time savings, celebrate efficiency gains (Gestlat ThinkLab, 2021–2024).
Timeline to Full Adoption:
Realistic implementation timeline based on experience (Gestlat ThinkLab, 2021–2024):
- Months 1-2: Planning, system configuration, initial training
- Months 3-4: Pilot with subset of program activities
- Months 5-6: Full rollout, troubleshooting, workflow refinement
- Months 7-12: Optimization, culture change consolidation
Full organizational integration: 9-15 months from decision to "new normal" (Gestlat ThinkLab, 2021–2024).
Results: What Organizations Actually Achieve
Implementation challenges are real. But so are results. Here's what organizations achieve when they successfully transition to real-time MEAL.
Efficiency Gains
Case Study: Health Program in Northern Uganda
250-person community health worker program transitioned from paper-based monthly reporting to real-time mobile MEAL in 2022 (Gestlat ThinkLab, 2021–2024).
Before (Traditional M&E):
- M&E officer time on data compilation: 60 hours/month (Gestlat ThinkLab, 2021–2024)
- Field supervisor time on report review: 40 hours/month (Gestlat ThinkLab, 2021–2024)
- Program manager data access: Monthly report, 3 weeks after month-end (Gestlat ThinkLab, 2021–2024)
- Total staff time on M&E: 100 hours/month (Gestlat ThinkLab, 2021–2024)
After (Real-Time MEAL):
- M&E officer time on data validation/analysis: 20 hours/month (Gestlat ThinkLab, 2021–2024)
- Field supervisor time on dashboard review: 15 hours/month (Gestlat ThinkLab, 2021–2024)
- Program manager data access: Real-time dashboard, updated daily (Gestlat ThinkLab, 2021–2024)
- Total staff time on M&E: 35 hours/month (Gestlat ThinkLab, 2021–2024)
Result: 65% reduction in M&E staff time, redirected to program support and quality improvement (Gestlat ThinkLab, 2021–2024).
Decision-Making Impact
Comparative Analysis: 45 Education Programs
Study comparing program responsiveness before and after real-time MEAL implementation (Gestlat ThinkLab, 2021–2024):
Traditional M&E (baseline):
- Average issues identified per quarter: 3.2 (Gestlat ThinkLab, 2021–2024)
- Average time from identification to corrective action: 8.7 weeks (Gestlat ThinkLab, 2021–2024)
- Percentage of issues resolved in same quarter as identification: 31% (Gestlat ThinkLab, 2021–2024)
Real-Time MEAL (post-implementation, 12 months):
- Average issues identified per quarter: 7.8 (Gestlat ThinkLab, 2021–2024)
- Average time from identification to corrective action: 1.6 weeks (Gestlat ThinkLab, 2021–2024)
- Percentage of issues resolved in same quarter as identification: 89% (Gestlat ThinkLab, 2021–2024)
Key Finding: Real-time systems don't just enable faster response—they surface more issues because staff know they can actually address them (Gestlat ThinkLab, 2021–2024).
Beneficiary Accountability
SMS Feedback System: Water Program in Tanzania
Program serving 45 rural communities implemented SMS-based feedback system integrated with real-time MEAL dashboard (Gestlat ThinkLab, 2021–2024).
Engagement Metrics:
- Beneficiaries who submitted feedback: 67% over 12 months (Gestlat ThinkLab, 2021–2024)
- Issues reported via SMS: 234 (Gestlat ThinkLab, 2021–2024)
- Issues addressed within 2 weeks: 87% (Gestlat ThinkLab, 2021–2024)
- Beneficiary satisfaction with accountability: Increased from 41% to 82% (Gestlat ThinkLab, 2021–2024)
Program Manager Reflection: "Before, beneficiaries would mention problems in community meetings, and we'd take notes. Maybe we'd address them eventually. Now they text us, it appears on our dashboard with GPS location, we respond within days. They trust we're listening because they see action." (Gestlat ThinkLab, 2021–2024)
Donor Confidence
While MEAL emphasizes accountability to beneficiaries, donors also value real-time data access.
Donor Perception Study:
Survey of 56 institutional donors funding African development programs (Gestlat ThinkLab, 2021–2024):
Question: "How does real-time data access affect your confidence in program management?"
- Significantly increases confidence: 73% (Gestlat ThinkLab, 2021–2024)
- Somewhat increases confidence: 21% (Gestlat ThinkLab, 2021–2024)
- No difference: 6% (Gestlat ThinkLab, 2021–2024)
- Decreases confidence: 0% (Gestlat ThinkLab, 2021–2024)
Qualitative Themes:
- "Shows us management is proactive, not reactive"
- "Transparency builds trust"
- "We can see problems being addressed in real-time, not just read about them in retrospective reports"
- "Enables genuine partnership—we can support troubleshooting, not just judge outcomes" (Gestlat ThinkLab, 2021–2024)
Learning and Adaptation
Longitudinal Study: Agricultural Livelihoods Program
Three-year program in Western Kenya tracked learning velocity pre- and post-MEAL implementation (Gestlat ThinkLab, 2021–2024):
Years 1-2 (Traditional M&E):
- Programmatic adjustments based on data: 4 total (Gestlat ThinkLab, 2021–2024)
- Time from data indicating need to adjustment implementation: 14 weeks average (Gestlat ThinkLab, 2021–2024)
- Staff assessment: "We learned what worked after the program ended" (Gestlat ThinkLab, 2021–2024)
Year 3 (Real-Time MEAL):
- Programmatic adjustments based on data: 11 in 12 months (Gestlat ThinkLab, 2021–2024)
- Time from data indicating need to adjustment implementation: 2.3 weeks average (Gestlat ThinkLab, 2021–2024)
- Staff assessment: "We're learning and adapting continuously—this is what adaptive management should feel like" (Gestlat ThinkLab, 2021–2024)
Impact on Outcomes:
Program compared beneficiary outcomes achieved in final year (with real-time MEAL) vs. first two years:
- Target achievement rate Year 1-2 average: 68% (Gestlat ThinkLab, 2021–2024)
- Target achievement rate Year 3: 87% (Gestlat ThinkLab, 2021–2024)
- 19-point improvement attributed primarily to adaptive management enabled by real-time data (Gestlat ThinkLab, 2021–2024)
Common Misconceptions Addressed
"Real-Time MEAL Is Only for Large Organizations"
Reality: Small programs may benefit most.
When you have 5 field staff and 1,000 beneficiaries, you can't afford to waste 8 weeks discovering problems. The efficiency gains from real-time data are proportionally larger for smaller programs (Gestlat ThinkLab, 2021–2024).
Technology costs have decreased dramatically. Free or low-cost mobile data collection platforms (KoBoToolbox, ODK, CommCare) enable even small NGOs to implement real-time systems for under $1,000 annually (Gestlat ThinkLab, 2021–2024).
"It Requires Reliable Internet"
Reality: Offline-capable mobile tools solve this.
Field staff collect data offline. Systems sync when connectivity available (which happens eventually, even in remote areas). Dashboard access requires internet, but that's for office staff in locations that typically have connectivity (Gestlat ThinkLab, 2021–2024).
Our implementation experience: 94% of programs operate in areas with intermittent connectivity. Offline-capable tools work in all of them (Gestlat ThinkLab, 2021–2024).
"Staff Won't Adopt Mobile Technology"
Reality: Adoption rates exceed 85% when implementation is done well.
The key is appropriate training and support:
- Initial hands-on training (1-2 days)
- Simple, intuitive interfaces
- Technical support via phone/WhatsApp
- Peer learning and support structures
With these elements, even staff with limited prior technology experience adopt mobile MEAL tools successfully (Gestlat ThinkLab, 2021–2024).
"Real-Time Data Means More Reporting Burden"
Reality: Real-time MEAL reduces reporting burden.
Traditional M&E: Field staff collect data, then spend hours compiling it into reports.
Real-Time MEAL: Field staff collect data, dashboards auto-generate. Total time investment decreases by 50-70% (Gestlat ThinkLab, 2021–2024).
The confusion stems from thinking "real-time" means "more frequent manual reporting." It actually means "automated reporting that happens continuously in the background."
Implementation Recommendations
Based on lessons from 67 successful implementations, here's what actually works:
1. Start with Why
Before selecting tools, clarify why you're transitioning to real-time MEAL:
- Faster decision-making?
- Beneficiary accountability?
- Donor transparency?
- Program efficiency?
Your primary goal shapes what you implement and how you measure success (Gestlat ThinkLab, 2021–2024).
2. Pilot Before Rolling Out
Recommended Approach:
- Select 1-2 program activities for pilot (not entire program)
- Run parallel systems (traditional + real-time) for 2-3 months
- Document time savings and decision-making improvements
- Build internal champions before full rollout
Why It Works: Small wins build momentum. Proof of concept overcomes resistance (Gestlat ThinkLab, 2021–2024).
3. Invest in Change Management
Technology is 30% of implementation. Organizational change is 70% (Gestlat ThinkLab, 2021–2024).
Critical Elements:
- Leadership buy-in and visible support
- Staff involvement in design (not top-down imposition)
- Training that's hands-on and field-based
- Patience with the learning curve
- Celebration of early successes
4. Choose Appropriate Technology
Selection Criteria:
- Offline capability (non-negotiable for field tools)
- Mobile-first design
- Reasonable cost
- Good support/documentation
- Integration capability with existing systems
Common Mistake: Selecting the most feature-rich system rather than the most appropriate one. Simple systems that staff actually use beat sophisticated systems that sit unused (Gestlat ThinkLab, 2021–2024).
5. Focus on Data Use, Not Just Collection
The goal isn't "having more data faster"—it's "making better decisions."
Build data use into workflows:
- Weekly dashboard review meetings
- Automated alerts tied to action protocols
- M&E staff as decision support partners, not just reporters
- Beneficiary feedback loops with clear response timelines
Measurement: Track decisions made based on real-time data, not just data collected (Gestlat ThinkLab, 2021–2024).
Conclusion: From Reporting to Managing
The evolution from M&E to MEAL represents a fundamental shift in how development organizations relate to data. Traditional M&E treats data as a reporting obligation—something you collect to satisfy donors and document what happened.
Real-time MEAL treats data as a management tool—something you use to run programs effectively and demonstrate accountability to those you serve.
The evidence is compelling:
- 65% reduction in M&E staff time (Gestlat ThinkLab, 2021–2024)
- 4-5x faster problem identification and response (Gestlat ThinkLab, 2021–2024)
- 87% issue resolution in quarter of identification vs. 31% (Gestlat ThinkLab, 2021–2024)
- 19-point improvement in target achievement (Gestlat ThinkLab, 2021–2024)
- 82% beneficiary satisfaction with accountability vs. 34% (Gestlat ThinkLab, 2021–2024)
But perhaps most importantly: real-time MEAL enables the "learning" that MEAL frameworks promise but traditional M&E systems can't deliver. When you learn what's working in 2 days instead of 8 weeks, you can actually adapt while there's still time to improve outcomes.
The question isn't whether real-time MEAL is better than traditional M&E. The data settles that debate. The question is whether your organization is ready to make the transition from documenting programs to managing them.
The communities you serve deserve nothing less.
References
ALNAP. (2016). MEAL: What it is, why it matters, and how to do it better.
Gestlat ThinkLab. (2021–2024). Internal implementation and field research data [Unpublished raw data].
Humanitarian Accountability Partnership. (2020). The guide to the HAP standard in accountability and quality management.
OECD-DAC. (2019). Better criteria for better evaluation: Revised evaluation criteria definitions and principles for use.
3M Corporation. (2001). Visual processing research summary.
USAID. (2021). Collaborating, learning, and adapting (CLA) framework and maturity tool.
World Bank Independent Evaluation Group. (2023). Adaptive management in development programs: Performance analysis.

Author