

The shilling's 2026 fall read through 26 years of data: how big it is, what moves with it, a calendar pattern, and what the public data cannot yet test.

Research · Data Analytics · October 2026
The shilling's October 2026 fall is among its largest one-month drops since 2000 and almost entirely Uganda's own. Twenty-six years of data show a calendar pattern we found no study testing, a possible oil link that rests largely on March 2026, and a gap: the flows most often blamed are the ones the public data cannot yet test.
This paper reads the shilling's 2026 fall through data rather than opinion. We assembled 26 years of monthly data (2000 to 2026) on the exchange rate and 20 factors the research literature links to it, plus 969 days of daily rates since March 2024, and searched them for patterns with standard statistical tests and with machine learning. We report what the data shows and how strongly. Whether each pattern is cause or coincidence is left to economists, and Section 11 sets out the questions.
26 yearsof monthly data, 2000 to 2026
20 factorsthe research literature links to the shilling
969 daysof daily rates since March 2024
63 studiesreviewed to choose the factors
Key findings
The move
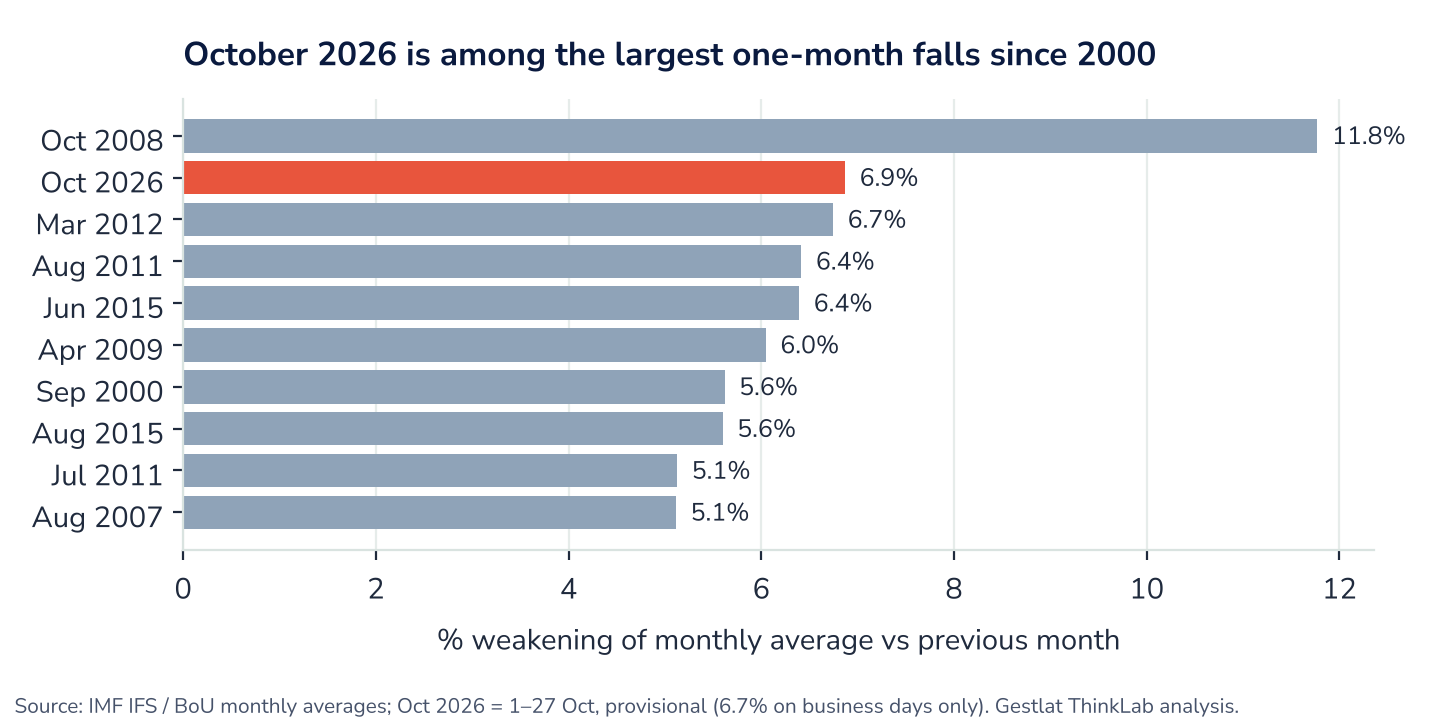
6.7–6.9%Size of the fallOn a provisional measure (1 to 27 October), the October 2026 average of about 4,130 per US dollar is 6.7 to 6.9% weaker than September's: roughly level with March 2012 as the second-largest one-month fall since 2000, after October 2008 (11.8%). It is down about 19% since its October 2025 low (fawazahmed0, 2024–2026; International Monetary Fund, n.d.; Ministry of Finance, Planning and Economic Development, 2016–2026). Source: IMF IFS; BoU/MoFPED; daily rate archive (fawazahmed0, 2024–2026; International Monetary Fund, n.d.; Ministry of Finance, Planning and Economic Development, 2016–2026)
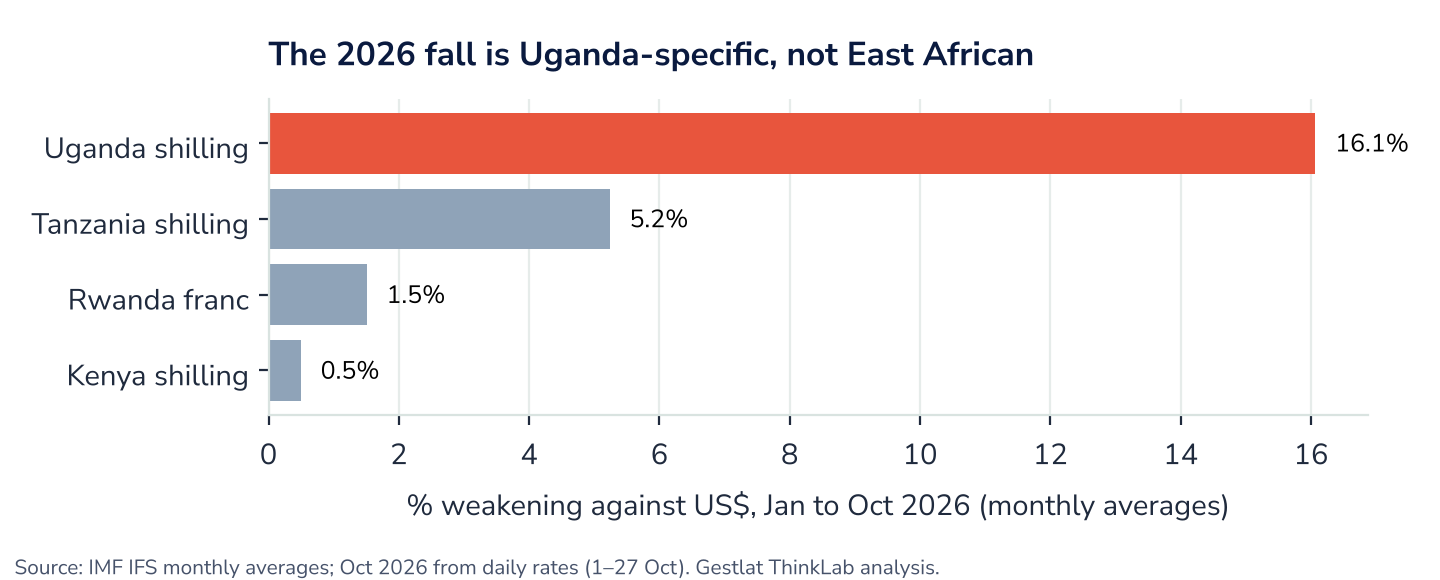
16.1%Uganda's own moveFrom January to October 2026 the shilling weakened 16.1% against the dollar, against 5.2% for the Tanzania shilling, 1.5% for the Rwanda franc and 0.5% for the Kenya shilling (fawazahmed0, 2024–2026; International Monetary Fund, n.d.). Source: IMF IFS; daily rate archive (fawazahmed0, 2024–2026; International Monetary Fund, n.d.)
The patterns
99.7%Stress regimeA two-state statistical model puts the shilling back in its 'stressed' state with 99.7% probability. Daily volatility since August 2026 is 0.76% a day, double the previous 29 months. Source: Gestlat ThinkLab analysis of IMF IFS monthly and daily archive rates
20 of 27CalendarOver 26 years the shilling weakened in March in 20 of 27 years (1.48% on average, against 0.18% in other months) and in February in only 7. The shape holds in both 2000 to 2015 and 2016 to 2026; we found no study that tests it. Source: Gestlat ThinkLab analysis of IMF IFS monthly rates, 2000–2026
The links
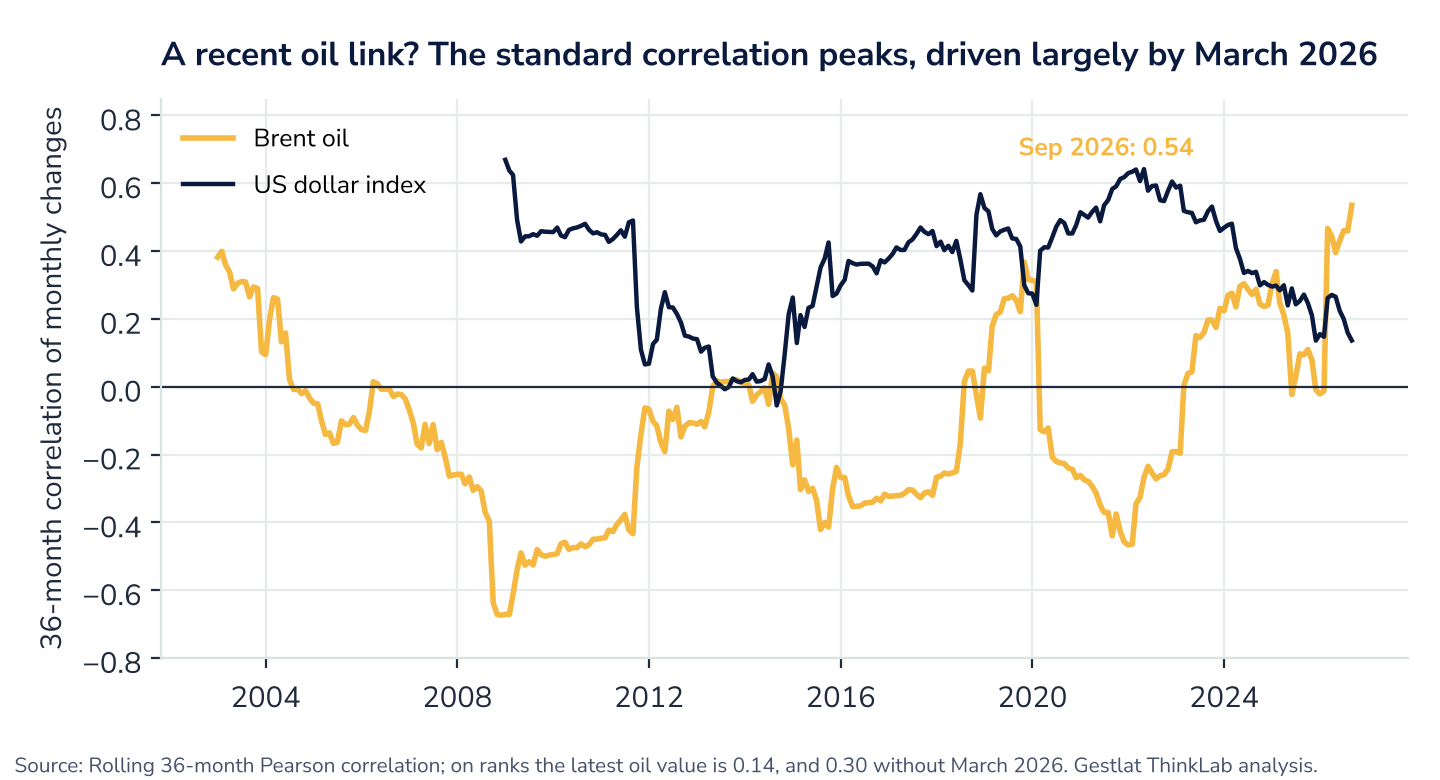
0.14OilOver 26 years, oil and the shilling show no reliable link. The 36-month correlation reached 0.54, the highest since 2003, but rests largely on March 2026; on ranks it is only 0.14. Source: Gestlat ThinkLab analysis; World Bank, EIA (Brent); IMF IFS
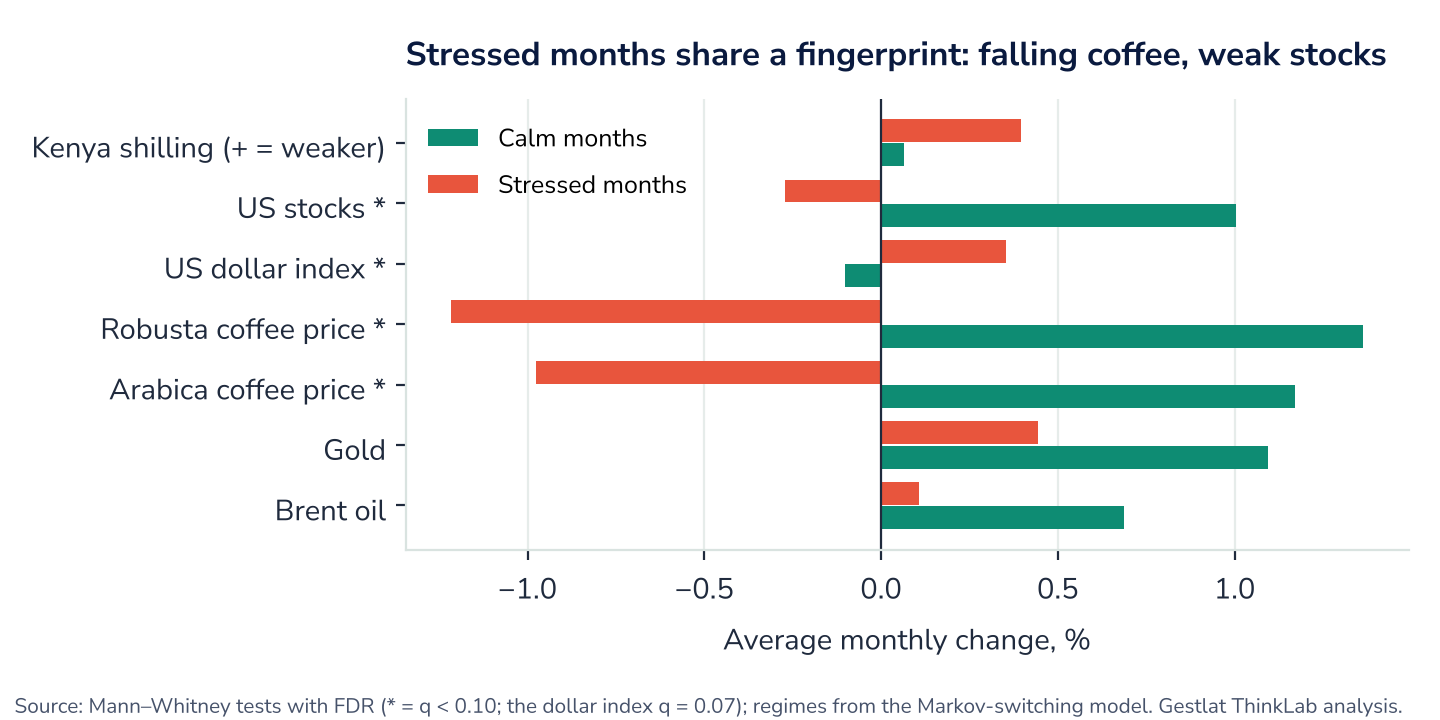
0.30Global fingerprintThe shilling moves with the Kenya shilling and the US dollar index (0.30 each) and against US stocks (-0.25). Its stressed months come with falling coffee prices and weak global stocks, yet September 2026 does not look like a global-shock month. Source: Gestlat ThinkLab analysis; FRED, S&P, IMF IFS, World Bank
Links and limits
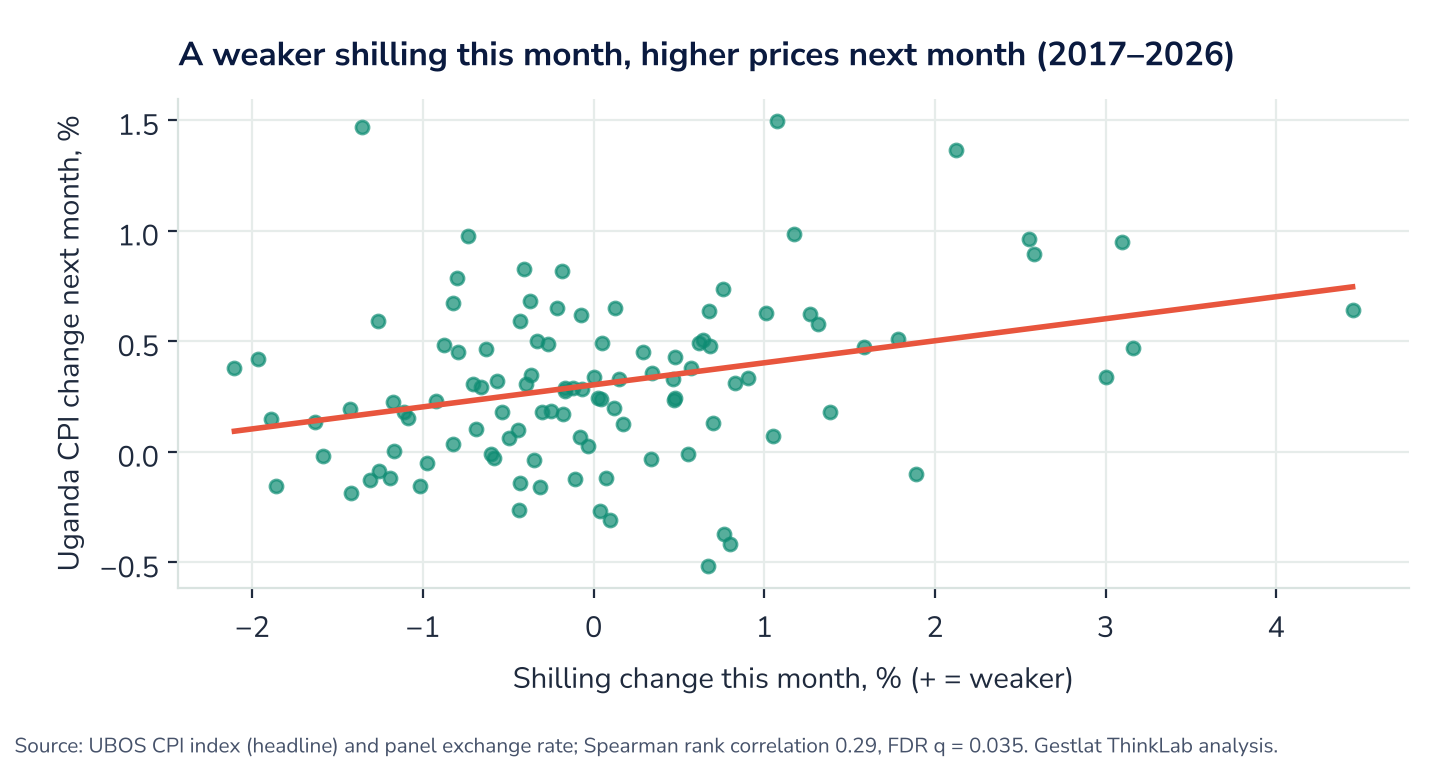
0.29PricesA weaker shilling this month goes with higher consumer prices next month (rank correlation 0.29, 2017 to 2026). Source: Gestlat ThinkLab analysis; UBOS CPI, IMF IFS
52%LimitsWith 35 inputs, machine learning calls next month's direction no better than always guessing 'weaker'. The flows officials name (trade deficit, oil imports, remittances, portfolio outflows, reserves) lack long public monthly series to test. Source: Gestlat ThinkLab analysis (random forest, 35 inputs)
1. Why read the shilling through data

On 23 October 2026 the shilling briefly touched about 4,500 per US dollar, its weakest in 33 years (Daily Monitor, 2026). On 14 October the Bank of Uganda raised the Central Bank Rate from 9.75% to 12% at an emergency meeting, and it had earlier raised the cash reserve requirement for banks from 11% to 13.5% from 24 September (Bank of Uganda, 2026; Reuters, 2026). Global conditions shifted too: the Middle East war raised energy prices and weakened many developing-country currencies (United Nations Conference on Trade and Development, 2026). Officials and analysts have named several causes: oil above US$100 a barrel after the Middle East war, a stronger US dollar and a US rate rise in September, a large import bill, weaker tourism earnings linked to the Ebola threat, changes in coffee and cocoa prices, and foreign investors selling government bonds (Ministry of Finance, Planning and Economic Development [MoFPED], 2016–2026; Reuters, 2026; Rio Times, 2026); the IMF has also flagged a risk to remittances from the Gulf (International Monetary Fund [IMF], 2026a).
Most public discussion weighs these causes by argument. This paper asks a narrower question: what does the record of numbers show, and which of these explanations can the public data actually test? It follows three steps. First, a review of 63 studies on what moves the shilling and similar currencies, to list the candidate factors. Second, the collection of every series we could obtain and verify for those factors. Third, two kinds of analysis: tests of the named factors, and open pattern-finding with machine learning that assumes nothing in advance.
This paper reports associations, not causes. A pattern that passes our tests is worth explaining; it is not proof of a mechanism. We make no forecast and give no policy or investment advice.
2. Data and approach in brief

The core series is the monthly average shilling rate from the IMF's International Financial Statistics from 1990, matched to the official Bank of Uganda figures published by the Ministry of Finance (they agree to within 0.11 shillings a month on average since 2016) (IMF, n.d.; MoFPED, 2016–2026). Daily rates from March 2024 come from an open archive of daily rates, which agrees with the official monthly averages to within 0.07% (fawazahmed0, 2024–2026). Global series (oil, gold, coffee, the US dollar index, US interest rates, US stocks and the VIX fear index) come from the World Bank, the US Federal Reserve and other official publishers (Federal Reserve Bank of St. Louis, n.d.; US Energy Information Administration et al., n.d.; World Bank, 2026). Uganda's consumer price index comes from UBOS tables from July 2017 (Uganda Bureau of Statistics, 2026).
All tests use monthly changes, not levels, because two series that both trend upward always look related. Where we ran many tests at once, we corrected for the chance of false hits (the Benjamini-Hochberg false discovery rate). Machine-learning results count only if they hold on years the model never saw and beat the same model run on shuffled data. Section 12 lists every assumption and how we handled it; the Annex describes the methods and data.
Data used in this paper
| Series | Span | Source |
|---|---|---|
| Shilling, Kenya, Tanzania, Rwanda per US$ (monthly) | 1990 to Oct 2026 | IMF IFS; BoU/MoFPED; daily archive for Oct 2026 (Tanzania from May 2025, Rwanda from Aug 2026) |
| Shilling per US$ (daily) | 2 Mar 2024 to 27 Oct 2026 | Open daily-rate archive, validated vs official |
| Brent, gold (monthly) | 1960 to Sep 2026 | World Bank Pink Sheet; EIA; LBMA |
| Arabica, robusta coffee (monthly) | 1960 to Jan 2026 | World Bank Pink Sheet |
| US dollar index, Fed rate, US 10-year yield | 2006 / 1954 / 1962 to Sep-Oct 2026 | US Federal Reserve (FRED) |
| VIX, S&P 500, US CPI | 1990 / 1871 / 1913 to 2026 | CBOE; S&P; US BLS |
| Uganda CPI | Jul 2017 to Aug 2026 (Sep 2026 used descriptively) | UBOS |
| BoU Central Bank Rate | Jul 2016 to Oct 2026 | BoU, MoFPED reports |
| Uganda trade (monthly) | May 2023 to Aug 2026 | BoU via MoFPED reports |
3. How big is this move?

Measured by monthly averages, October 2026 is one of the shilling's two or three largest one-month falls since 2000. Only October 2008, at the height of the global financial crisis, was clearly larger (11.8%). October's figure is provisional: counting all days from 1 to 27 October it is 6.9%, counting business days only it is 6.7%, which is level with March 2012 (6.75%). Over two months (August to October) the fall is about 10.8%, the seventh-largest two-month move since 2000.
11.8%October 2008: the largest one-month fall
6.7–6.9%October 2026, provisional
10.8%August to October 2026
1.6%/monthpace of the current 19.4% run
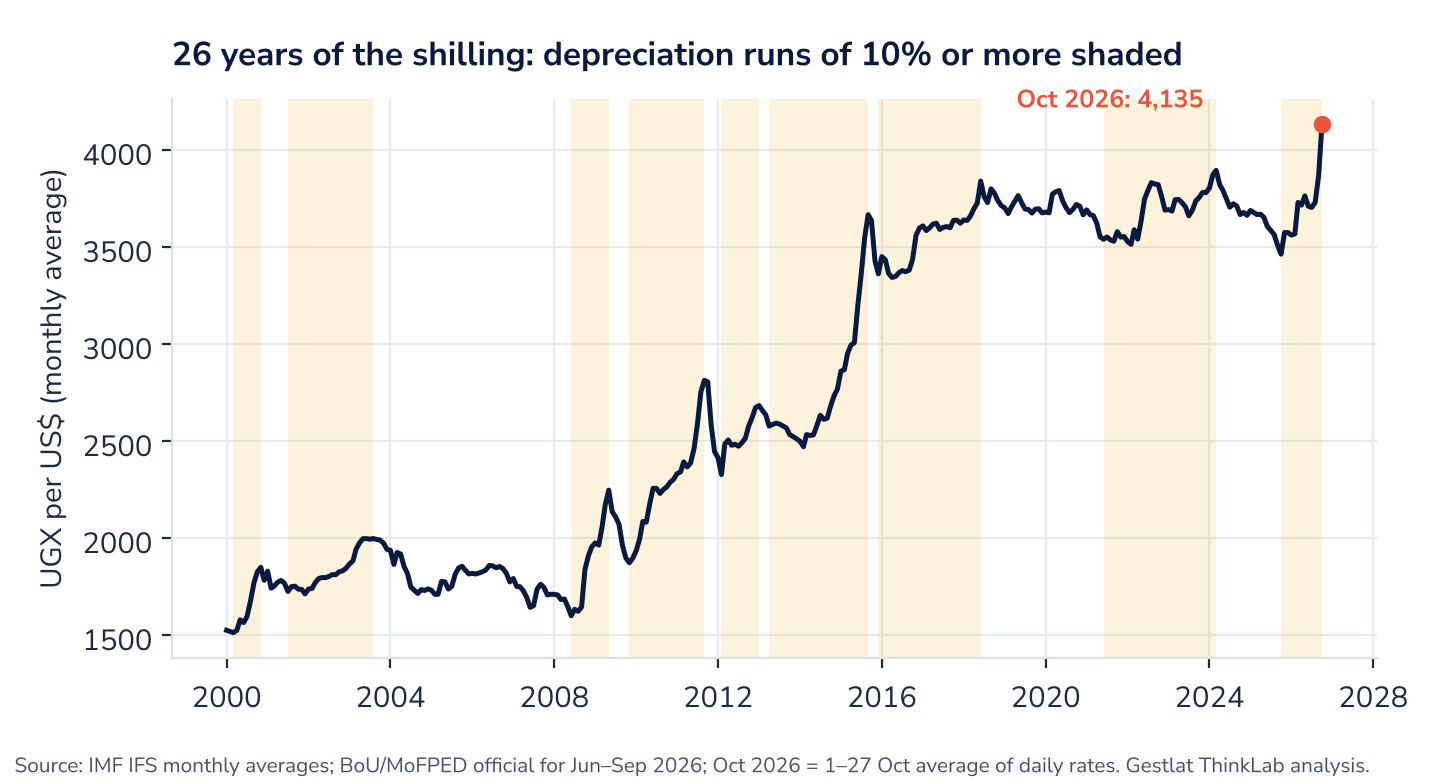
The current run is not the largest in size. Since 2000 there have been nine runs in which the shilling weakened by 10% or more, including the current one; a run ends when the rate retraces 5% from its peak. The largest were 2009 to 2011 (50.2%) and 2013 to 2015 (42.3%). The current run is among the faster ones: 19.4% in 12 months, or 1.6% a month, fourth-fastest of the nine after 2008 to 2009, 2000 and 2009 to 2011.
Depreciation runs of 10% or more since 2000 (monthly averages)
| Start | Peak | Months | Rise | Per month |
|---|---|---|---|---|
| Mar 2000 | Nov 2000 | 8 | 22.2% | 2.78% |
| Jul 2001 | Aug 2003 | 25 | 15.8% | 0.63% |
| Jun 2008 | May 2009 | 11 | 40.4% | 3.67% |
| Nov 2009 | Sep 2011 | 22 | 50.2% | 2.28% |
| Feb 2012 | Jan 2013 | 11 | 15.3% | 1.39% |
| Apr 2013 | Sep 2015 | 29 | 42.3% | 1.46% |
| Dec 2015 | Jun 2018 | 30 | 14.2% | 0.47% |
| Jun 2021 | Mar 2024 | 33 | 10.0% | 0.30% |
| Oct 2025 | Oct 2026 (so far) | 12 | 19.4% | 1.61% |
The move is also Uganda's own. Between January and October 2026 the shilling weakened 16.1% against the dollar while the Kenya shilling moved 0.5%, the Rwanda franc 1.5% and the Tanzania shilling 5.2%. Over 26 years the shilling's monthly moves are only loosely tied to its neighbours' (correlation 0.30 with Kenya, 0.17 with Tanzania), so a Uganda-only move is not unusual in itself, but its size in 2026 is.
4. Calm and stress: three eras

We let two methods divide the 26 years without telling them where to look. A break-detection algorithm found two dates where the shilling's behaviour changed: May 2008 and April 2016. From 2000 to May 2008 the shilling moved by about 1.8% a month (standard deviation) with little drift. From June 2008 to April 2016 it moved by 2.9% a month and drifted weaker by 0.75% a month on average. From May 2016 to September 2026 it was the calmest it has been, moving 1.2% a month with almost no drift.
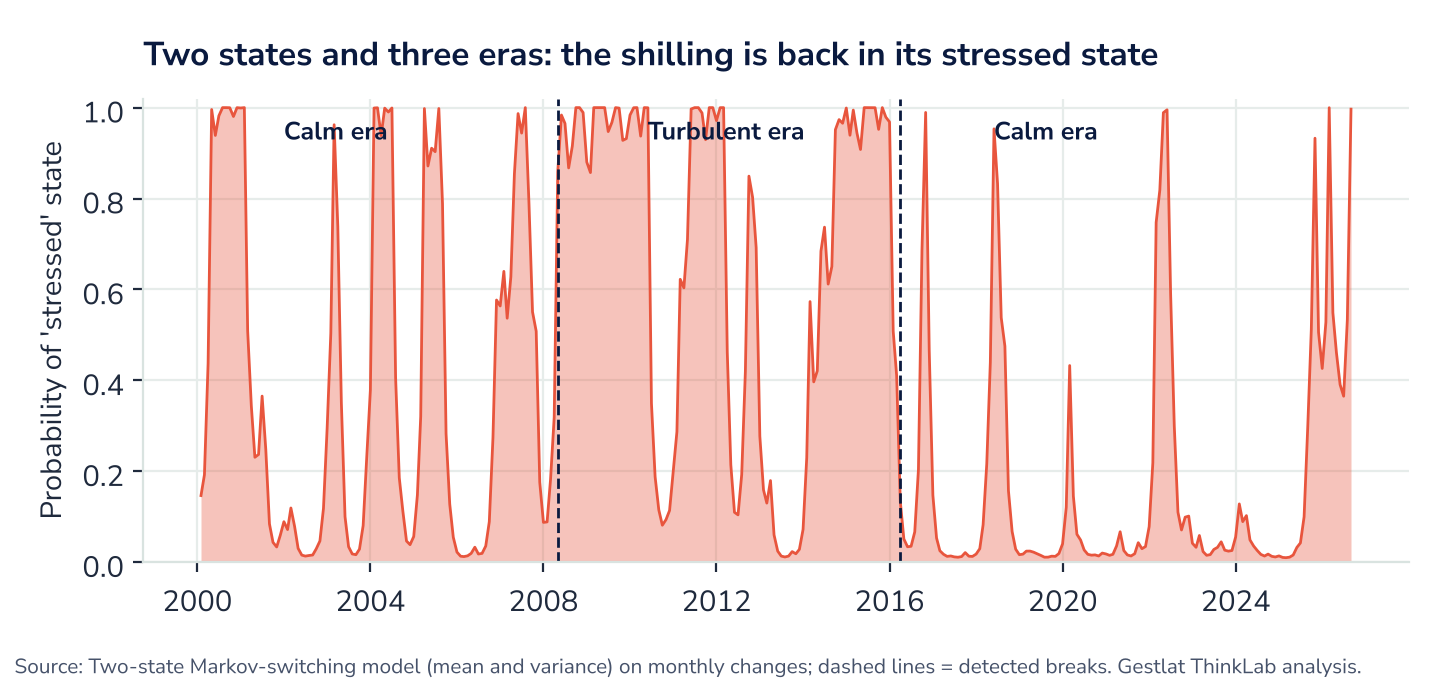
A second method, a two-state Markov-switching model, labels each month as calm or stressed. In the calm state the shilling's monthly change averages -0.07% with a standard deviation of 0.88%; in the stressed state it averages +0.84% with a standard deviation of 2.96%. Stressed spells have lasted about 7 months on average and calm spells about 10. The model put September 2026 in the stressed state with 99.7% probability, after three stressed spells since October 2025.
1.2%monthly move 2016 to 2026, the calmest era
99.7%September 2026 in the stressed state
7 vs 10average months: stressed vs calm spells
0.36→0.76%daily volatility, before vs since August 2026
At the daily level the same shift is visible. From March 2024 to July 2026 the shilling's daily change had a standard deviation of 0.36%. From August to October 2026 it was 0.76%, roughly double.
5. The calendar: February strong, March weak

Market commentary often mentions seasonal dollar demand: end-of-year imports, coffee seasons, dividends, school fees. Our review of 63 studies found none that tests month-of-year effects in the Uganda shilling (the nearest is a Ghana study that found quarter-of-year effects (Ohemeng et al., 2021)); the claims come from central bank and IMF narrative and from dealers (Bank of Uganda, 2017; IMF, 2024). So we tested them.
Over 2000 to 2026, March stands out. The shilling weakened in March in 20 of 27 years, by 1.48% on average, against 0.18% in the other months (Mann-Whitney test, one-sided p = 0.0007, two-sided 0.0014; sign test one-sided p = 0.010). February is the reverse: the shilling weakened in only 7 of 27 Februaries and on average strengthened by 0.60% (one-sided p = 0.005, two-sided 0.010). Because March and February were singled out after looking at the data, the fairer test is the one across all twelve months: differences this large would arise by chance about 0.4% of the time by a rank test and 2.6% by a stricter shuffling test.
20 of 27Marches with a weaker shilling
+1.48%average March move (other months 0.18%)
7 of 27Februaries with a weaker shilling
p = 0.026all-months shuffling test
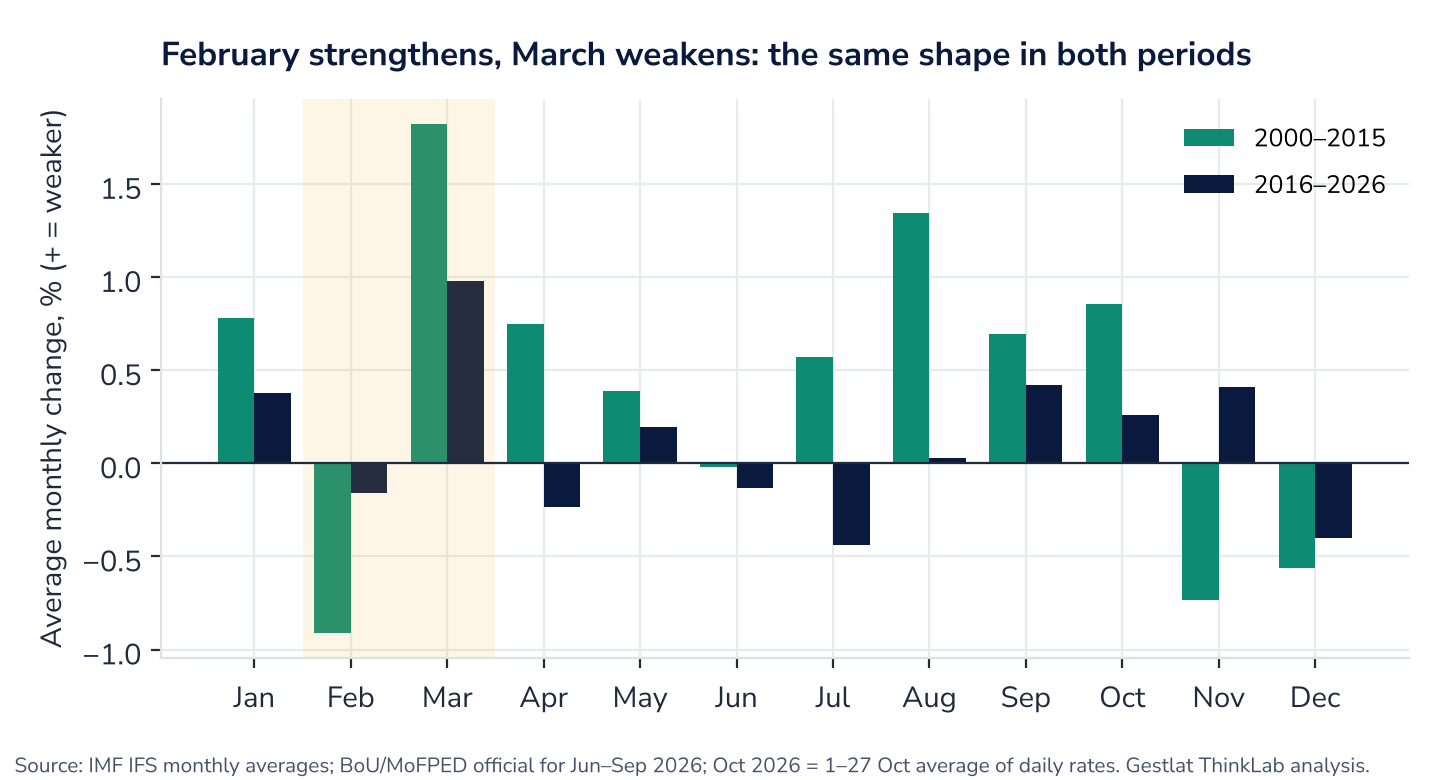
Two checks make this more than a lucky draw. First, the shape repeats in two separate periods: in 2000 to 2015, March averaged +1.82% (weaker in 75% of years) and February -0.91%; in 2016 to 2026, March averaged +0.98% (weaker in 73% of years) and February -0.16% (weaker in 18%). Second, the March effect survives removing the Marches of the 2011, 2015 and 2026 shocks: the remaining 24 Marches still average +1.27%, weaker in 17. Removing instead the four largest March falls (2009, 2010, 2012 and 2026) leaves 23 Marches averaging +0.88%, weaker in 16 (one-sided p = 0.015).
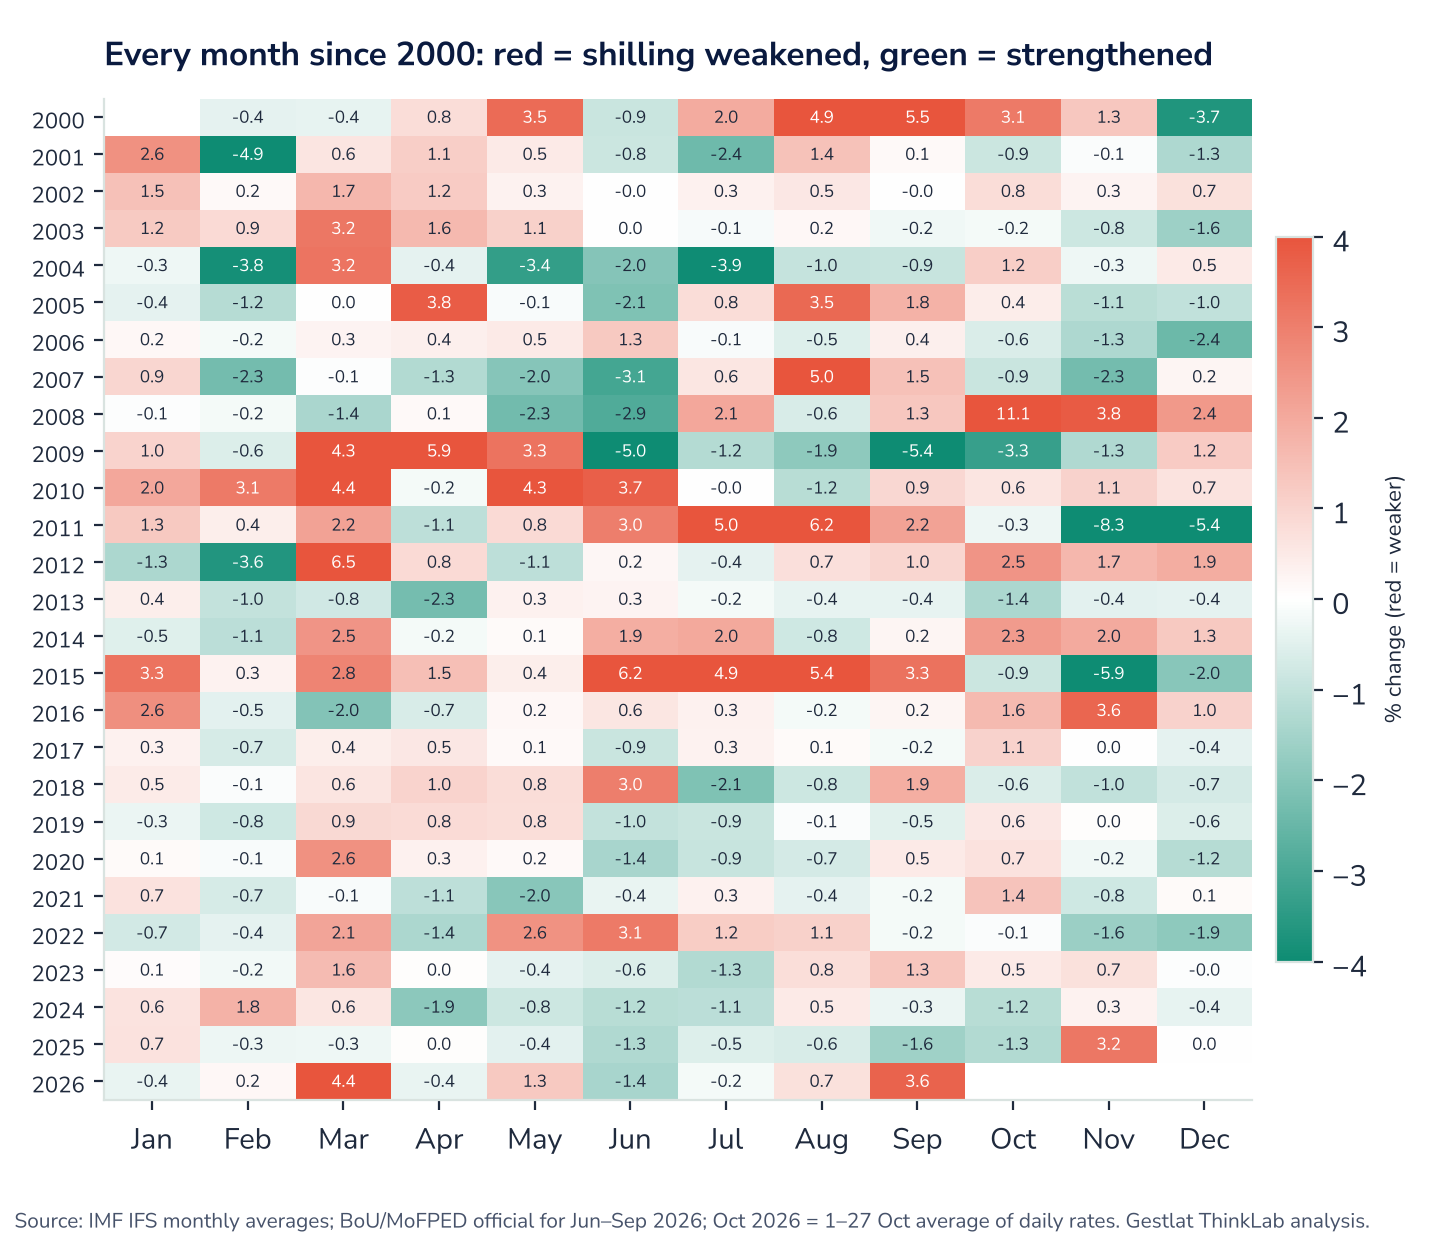
Three cautions apply. Each calendar month offers only 27 observations, and the all-months test is not significant in either half of the sample on its own; the pattern earns attention from its consistency, not from any single test. A standard seasonal decomposition (STL) of the exchange-rate level finds negligible seasonal strength, another reason to treat the pattern as unconfirmed. And a seasonal average does not make any single month predictable: used as a forecast in our out-of-sample tests, the calendar alone did worse than simply assuming the long-run average (Section 9). What would explain a strong February and weak March is for economists to judge; candidates are listed in Section 11.
6. What moves with the shilling

We tested 21 candidate factors, with each factor measured from six months before to three months after the shilling move: 210 tests in all. After correcting for multiple testing, the clearest same-month links are with the Kenya shilling (rank correlation 0.30), the US dollar's broad index (0.30), US stocks (-0.25), rises in the VIX fear index (0.17), the Tanzania shilling (0.17) and Uganda's own consumer prices (0.28, 2017 to 2026 only). The dollar index is available from 2006. The sign pattern is that of a 'risk-off' currency: the shilling tends to weaken when the dollar strengthens, global stocks fall and fear rises.
0.30rank correlation with the Kenya shilling
0.30with the US dollar broad index
−0.25with US stocks
210tests, corrected for false hits
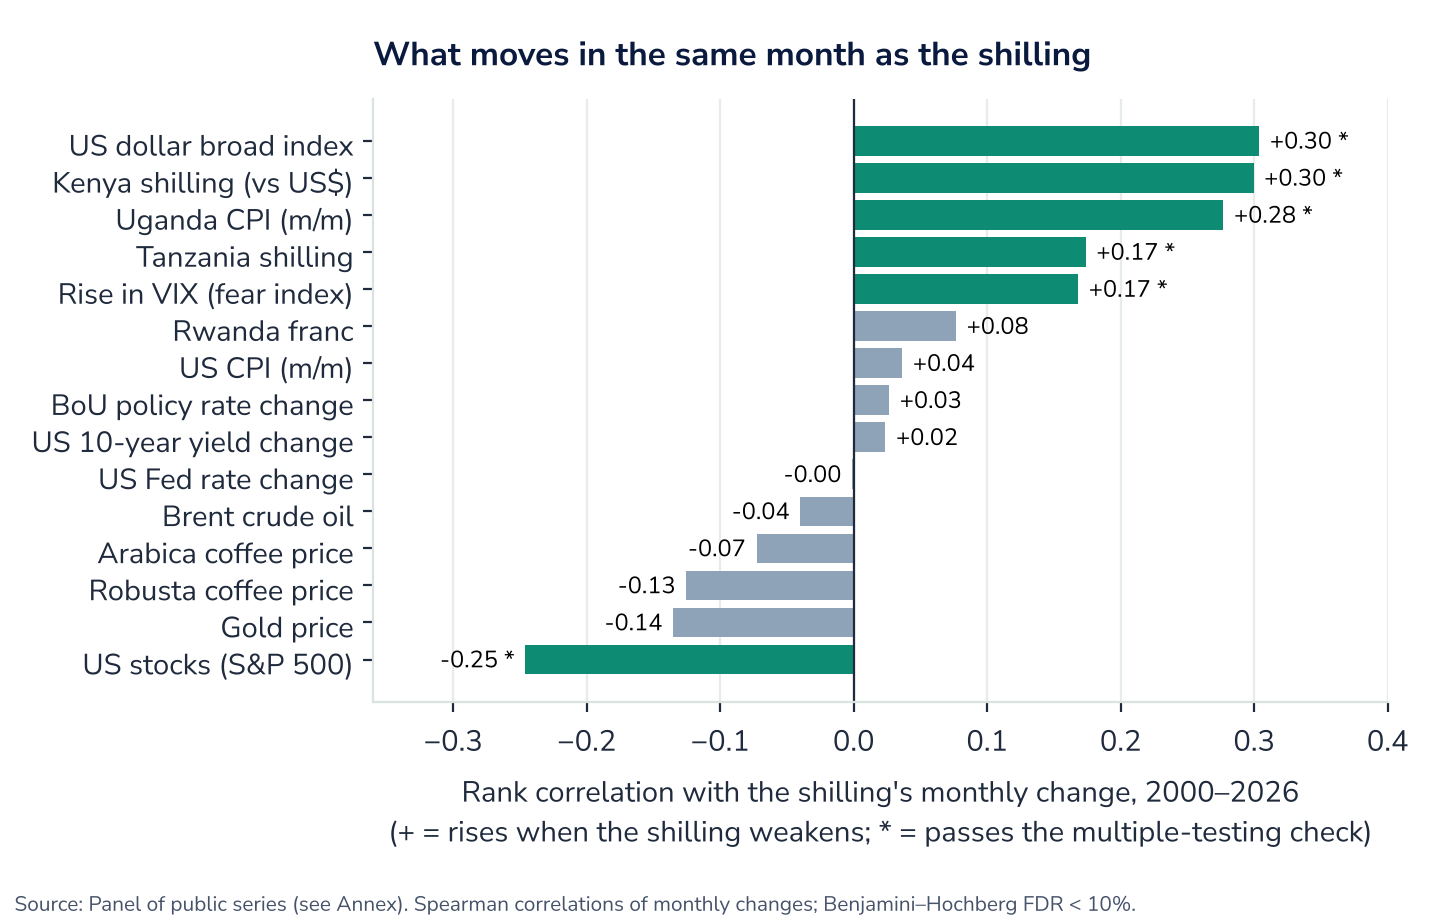
Several factors commonly named do not show a reliable link over the full 26 years: oil (-0.04), coffee prices (-0.07 arabica, -0.13 robusta, neither significant after correction), the US Fed rate and the US 10-year yield. Granger tests, which ask whether a factor's past helps predict the shilling, found no factor that passes the multiple-testing check at the 5% level; the strongest was Uganda's consumer prices (adjusted q = 0.09).
6.1 Signs of an oil link, resting on one month
The absence of a long-run oil link may hide a change over time, but the evidence is thin. A rolling 36-month standard correlation between the shilling and Brent crude has swung between -0.67 and +0.54 since 2003, and in September 2026 it stood at +0.54, the highest in the record. That figure rests largely on March 2026, when Brent rose 37% and the shilling weakened 4.5%: without that month it falls to 0.30, and measured on ranks, as elsewhere in this paper, it is only 0.14. As recently as January 2026 it was close to zero. The dollar link has moved the other way, from 0.64 in 2022 to 0.14.
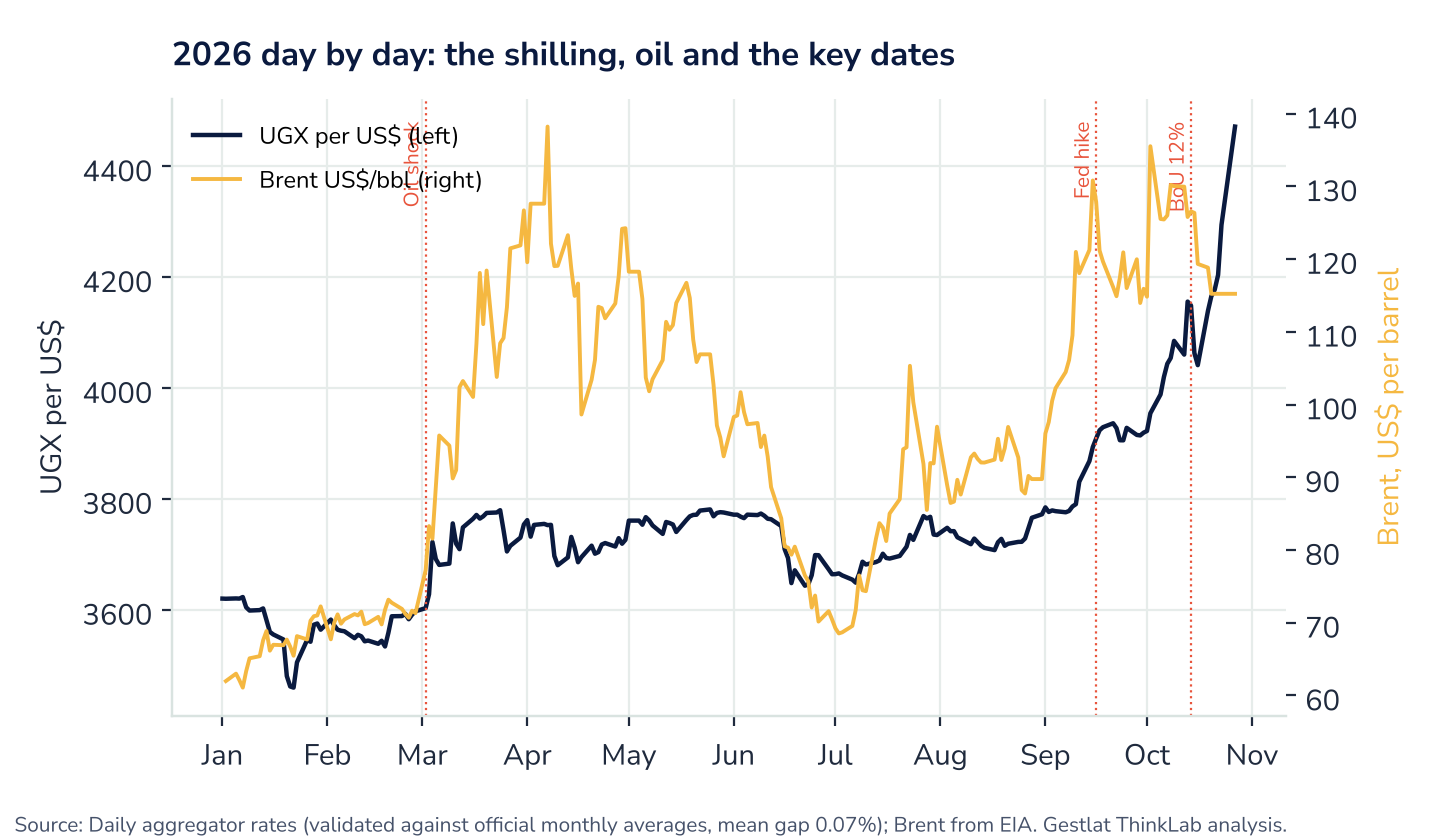
Daily data tell the same story for 2026. The shilling's first jump this year came with the oil shock in early March: Brent rose from about US$71 at the end of February to above US$100 by 12 March, and the shilling weakened 2.4% in the first week. Oil and the shilling then eased together through June. Brent rose again from about US$69 to US$97 during July, and the shilling followed from August.
6.2 The fingerprint of stressed months
Comparing the stressed and calm months found by the regime model shows what else is different when the shilling is under stress. In stressed months, robusta coffee prices fell by 1.2% a month on average against a rise of 1.4% in calm months; arabica fell 1.0% against a rise of 1.2%; US stocks fell 0.3% against a rise of 1.0%; the VIX averaged 21.7 against 18.6; and the dollar index rose. Coffee prices, US stocks and the VIX pass the multiple-testing check at 5%; the dollar index passes only at 10% (q = 0.07). Oil prices did not differ between the two kinds of month.
7. The shilling and prices

Over July 2017 to August 2026, months when the shilling weakened were followed by higher consumer price inflation in Uganda the next month (rank correlation 0.29, adjusted q = 0.035). The link is also present in the same month and, more weakly, in the other direction, so the data show the two moving within a one-month window rather than a clean sequence. A 2013 study of 1999 to 2012 data put pass-through at about 0.48 (Bwire et al., 2013), and the IMF's 2026 assessment puts it at about 0.3 (IMF, 2026a).
0.29shilling move vs next month's CPI
0.48pass-through, 2013 study
≈0.3pass-through, IMF 2026
4.6%headline inflation, September 2026
Headline inflation rose from 2.8% in March 2026 to 4.6% in September, with energy, fuel and utility prices up 14.5% on a year earlier (MoFPED, 2016–2026; Uganda Bureau of Statistics, 2026). Those figures predate October's fall.
8. 2026, day by day

The daily archive allows a closer look at the timeline. The table shows the shilling the business day before each key date and five business days after. Two cautions: these are market moves around dates, not measured effects of the events; and the archive's daily values may lag the market by a day and can differ from the Bank of Uganda's reported closing rates by 2 to 5% on volatile days.
The shilling around key dates in 2026 (UGX per US$)
| Date | Event | Day before | 5 business days after | Change |
|---|---|---|---|---|
| 2 Mar | Oil price jump (Middle East war) | 3,597 | 3,683 | +2.4% |
| 16 Sep | US Fed raises its rate 0.25 points | 3,894 | 3,906 | +0.3% |
| 24 Sep | BoU reserve requirement 13.5% takes effect | 3,906 | 3,923 | +0.4% |
| 5 Oct | Shilling first above 4,000 | 3,955 | 4,061 | +2.7% |
| 14 Oct | BoU raises rate to 12%; first dollar sale reported | 4,156 | 4,178 | +0.5% |
| 22 Oct | BoU sells dollars again (amount not disclosed) | 4,178 | 4,472 (27 Oct, 3 business days) | +7.0% |
At the daily level, one more pattern passes the multiple-testing check: a rise in the US dollar index on one day tends to be followed by a weaker shilling the next day (rank correlation 0.15). Because the archive's timing may lag by a day, this may reflect how the data are recorded rather than how the market works. We found no day-of-week effect and no turn-of-month effect in the daily data.
9. What the machine found

Alongside the tests above, we gave the full set of variables to pattern-finding methods that assume nothing about which factors matter. Prediction results had to hold on years the model had not seen and beat the same model on shuffled data; the clustering, analogue and anomaly results are descriptive.
- Clustering: grouping the months from 2006 to 2026 by all variables together separates a small group of 39 global-shock months (falling oil and stocks, a rising dollar and fear index, and a shilling weakening 2.4% a month on average) from the rest. September 2026 is not in the shock group.
- Historical analogues: the months most similar to September 2026 across all variables are October 2021, March 2022, September 2018, October 2016 and March 2026. None falls in the global-shock cluster, although March 2022 and March 2026 were months of war-related oil shocks.
- Anomaly detection: the most unusual months since 2006 are October to December 2008, March and April 2020, and August 2011. September 2026 ranks 65th of 243, unremarkable by global yardsticks. This again points to pressures the global variables do not capture.
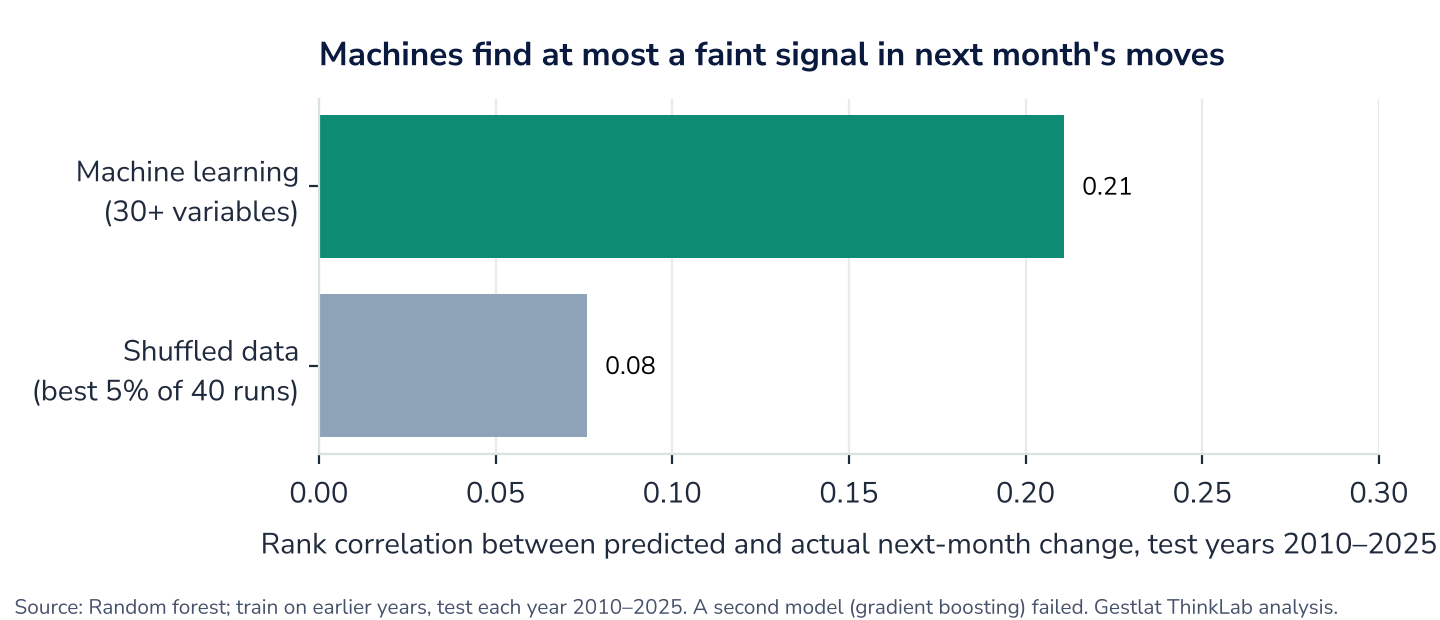
- Prediction: a random-forest model using 35 inputs known at month-end ranked next month's moves with a correlation of 0.21 in test years 2010 to 2025 (the last tested month is October 2025, because some inputs are not yet published for 2026), against 0.08 for the best 5% of 40 shuffled-data runs. It explained 1.4% of the variation and called the direction right 52% of the time, no better than always guessing 'weaker' (53%). A second model (gradient boosting) did worse than the long-run average, and so did the calendar averages alone. Because only one of the two models beat its shuffled runs, the signal fails our own two-method rule: treat it as faint and unconfirmed.
- Most informative inputs, measured on held-out months January 2020 to September 2025: the latest month's move in the Kenya shilling, then the shilling's own latest move, then the change in the VIX and US stocks; other inputs, including the dollar index, add little.
0.21random forest, test years 2010 to 2025
0.08best 5% of shuffled-data runs
52%direction right; always 'weaker' gets 53%
1.4%of the variation explained
Rule mining searched for combinations of conditions in the same month as weak months in 2000 to 2015 and then checked them on 2016 to 2026. Two rules looked promising on the later data: months when the Kenya shilling weakened and US stocks fell (weak shilling in 4 of 9 such months, against a base rate of 12%), and months when US stocks fell while the Fed raised rates (5 of 15). With 25 rules checked, neither survives correction for multiple testing. We list them as seen, not confirmed.
10. What the data cannot see

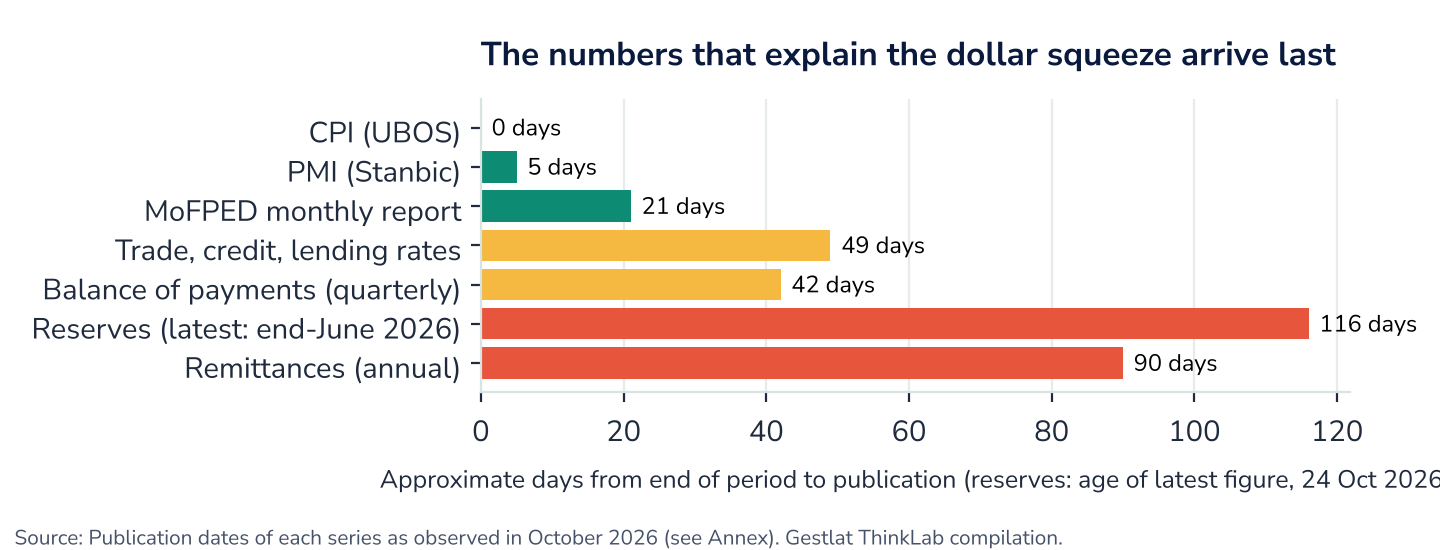
The factors officials and analysts name most often are domestic flows: the trade deficit, the oil import bill, remittances, coffee export receipts, portfolio flows and reserves. These are exactly the series we could not test over long periods. Monthly trade data were available to us only from May 2023, coffee export volumes from 2025, and reserves as scattered points; quarterly balance-of-payments and remittance series were not available in machine-readable form. Long histories exist inside central bank and statistics office publications, often as PDF tables.
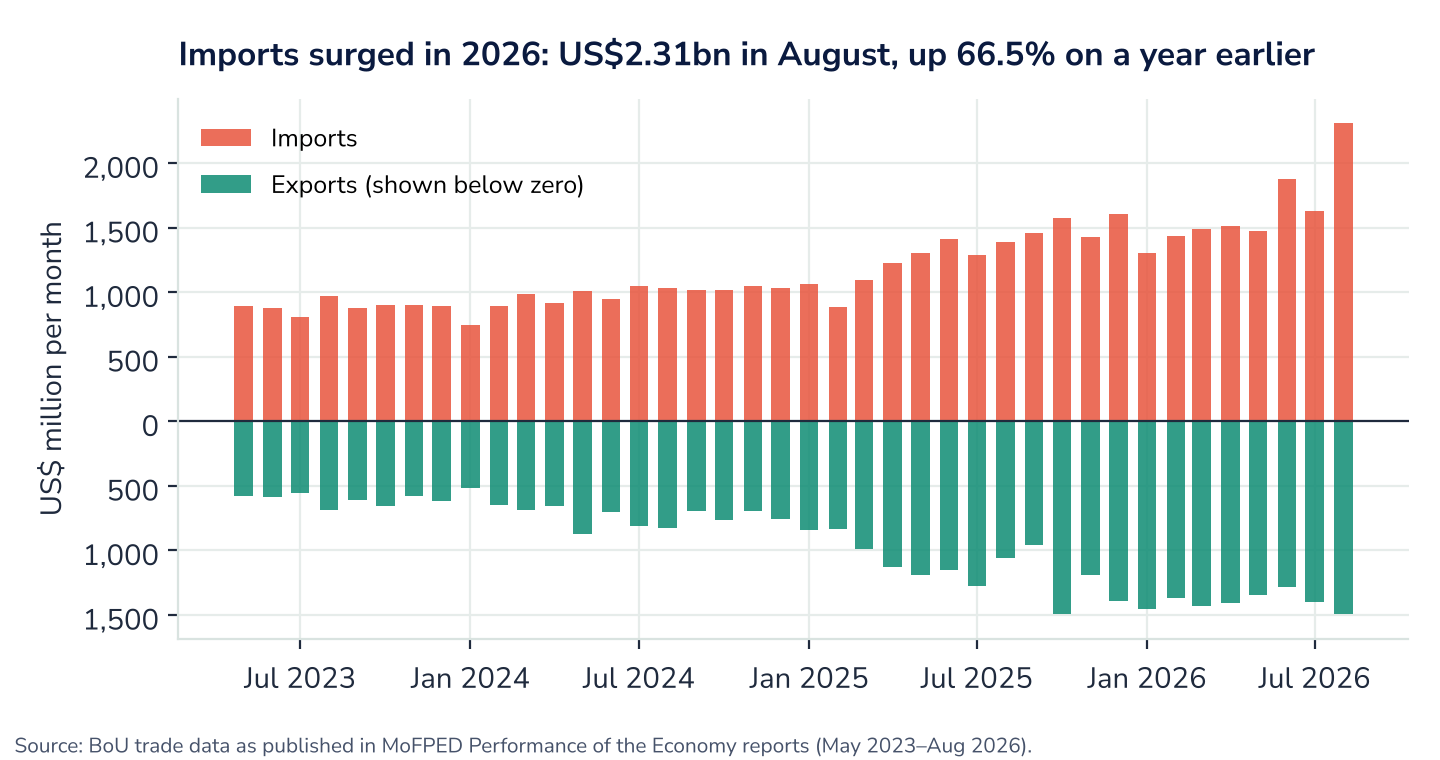
What the recent data do show is a sharp change in 2026. Merchandise imports reached US$2,309 million in August 2026, up 66.5% on a year earlier, and the monthly trade deficit of US$817 million was the largest since at least May 2023. Oil imports were US$245 million in August after US$306 million in June. Gold made up about 60% of exports, while coffee receipts (US$182 million in August) were below a year earlier (MoFPED, 2016–2026).
US$2,309mimports, August 2026 (+66.5%)
US$817mtrade deficit, August 2026
≈60%gold's share of exports
7 weeksabout how late trade data arrive
Timing compounds the gap. When the shilling crossed 4,000 on 5 October, the latest published reserves figure was for the end of June, and trade data run about seven weeks behind. Of the series that matter here, only consumer prices and the business survey arrive within a week of the month's end. The amounts of the Bank's dollar sales in October have not been published.
11. Coincidence or sense? Questions for economists

Each pattern below appears in our analysis; the Strength column says how it was tested. The possible explanations are drawn from the literature and official narrative; we have not tested them, and some may be wrong.
Patterns found and candidate explanations
| Pattern in the data | Strength | Candidate explanations (untested here) | What would settle it |
|---|---|---|---|
| March weak, February strong (26 years) | All-months shuffling test p = 0.026; consistent in two periods | Dividend and profit payments abroad (timing undocumented; the IMF notes seasonal repatriation in late 2023) (Bank of Uganda, 2017; International Monetary Fund, 2024); coffee off-season; school-fee inflows in January and February; donor and NGO inflow timing (Bank of Uganda, 2017) | Monthly dividend outflows, coffee receipts and NGO inflows from BoU |
| Shilling moves with the dollar index, Kenya shilling and against US stocks | Correlations 0.25 to 0.30; pass FDR | Global risk appetite and portfolio flows into government securities (International Monetary Fund, 2026a; Kemoe et al., 2023) | Monthly non-resident holdings of government securities |
| A possible recent oil link | Standard 36-month correlation 0.54, but 0.14 on ranks and largely one month (March 2026) | Larger oil import bill; oil-project imports; less offsetting from coffee and gold (International Monetary Fund, 2026a) | Monthly oil import values and volumes, 2010 to 2026 |
| Stressed months come with falling coffee prices | Passes FDR | Terms of trade: lower export receipts (Opolot & Anguyo, 2007) | UCDA monthly receipts against the shilling |
| Shilling weakens, prices rise the next month | 0.29; q = 0.035 | Pass-through of import costs to prices (Bwire et al., 2013) | Item-level CPI for imported goods |
| September 2026 unlike past global-shock months | Clustering and anomaly ranks | Domestic or oil-specific pressures not captured by global variables | The domestic flow series in Section 10 |
The literature itself is divided on several of these. Studies find terms of trade strengthen the shilling in the long run (Opolot & Anguyo, 2007), while others find volatility spillovers between oil and food prices and the shilling low outside crisis periods (Katusiime, 2019); the 2015 to 2016 fall happened while oil prices were falling (Budget Monitoring and Accountability Unit, 2016).
12. Assumptions and how we handled them
Assumptions, risks and how each was handled
| Assumption or risk | How we handled it |
|---|---|
| Monthly averages represent the shilling well | Used IMF/BoU monthly averages throughout; matched to official figures (mean gap 0.11 shillings since 2016). End-month rates differ and were not mixed in. |
| October 2026 is incomplete | Used the 1 to 27 October average only for size comparisons, and reported it as a range (all days or business days); excluded October from all monthly statistical tests. Daily tests include October days. |
| Daily rates come from an open archive, not the BoU | Checked against official monthly averages for 31 months (mean gap 0.07%; monthly changes correlate at 0.995). Flagged that its daily timing may lag by a day and that it can differ from BoU closing rates on volatile days; the one-day dollar lead is reported with that caveat. |
| Series spliced from different publishers | Splices only where a series ends (IMF to official in June 2026; World Bank to EIA/LBMA after January 2026), with overlaps checked. |
| Trending series look related | All tests on monthly changes, not levels. |
| Many tests produce false hits | Benjamini-Hochberg correction across the 210 lead-lag tests, the Granger tests and the factor comparisons; rules that fail correction listed as unconfirmed. Patterns picked after looking (March, February) judged by the all-months test. |
| Small samples | 27 observations per calendar month; CPI from 2017 (109 months); trade from May 2023 (40 months, descriptive only). Required consistency across sub-periods before reporting a calendar pattern. |
| Machine learning finds patterns in noise | Trained only on earlier years and tested on each later year (2010 to September 2025; no 2026 month could be tested because some inputs are not yet published); compared with 40 shuffled-data runs that keep the series' memory; required agreement across two models, which the prediction signal did not achieve. |
| Missing domestic flows bias the picture | Not tested; listed in Section 10. Global variables may stand in for domestic flows they move with. |
| World coffee prices stand for Uganda's receipts | Treated only as a terms-of-trade proxy; receipts series listed as a gap. |
| Calendar markers are approximate | School-term starts set at February, May and September; election periods matter for yields in Uganda (International Monetary Fund, 2026b) but showed no reliable link with the shilling here; election months from the Electoral Commission (2026) (Electoral Commission of Uganda, 2026) and public records for 2006 to 2021. |
| Policy-rate history has gaps | August to December 2017 left empty rather than filled. |
| Some 2026 events come from press reports | Marked as such; amounts of BoU dollar sales not stated because not published. |
| Statistical states are not causes | Regimes and clusters are labels for patterns in the data, described without attributing cause. |
What this means for decision-makers

The shilling's behaviour in 2026 is unusual in speed and in being Uganda's own, and the global variables that have lined up with its past stress do not account for it. The domestic flows that would settle the question are published late, in fragments, or not at all at monthly frequency. Real-time, machine-readable data on imports, oil, coffee receipts, remittances and portfolio holdings would let analysts, firms and policymakers see pressure as it builds rather than months later. That is the gap between data that is collected and data that can be used.
Annex: methods and data

- Literature: 63 studies on the shilling and comparable currencies (Kenya, Tanzania, Rwanda, Ghana, Zambia), read in full (37) or as abstracts (26), used to list 20 candidate factors.
- Monthly panel 2000 to 2026: shilling and regional currencies (IMF IFS, BoU/MoFPED), Brent, gold, coffee (World Bank Pink Sheet, EIA, LBMA), US dollar broad index, Fed funds rate, US 10-year yield (FRED), VIX, S&P 500, US CPI, Uganda CPI (UBOS, from 2017), Central Bank Rate (from 2016), election and calendar markers.
- Daily panel March 2024 to October 2026: shilling, Kenya and Tanzania shillings, gold (open daily archive, validated), Brent (EIA), dollar index and US yields (FRED), VIX.
- Tests: month-of-year (Kruskal-Wallis, permutation, Mann-Whitney, sign tests, STL); lead-lag Spearman correlations (lags -3 to +6 months); Granger causality (lags 1 to 3); rolling 36-month correlations; break detection (binary segmentation); two-state Markov-switching regression; Benjamini-Hochberg false discovery rate.
- Open discovery: k-means clustering (k chosen by silhouette), nearest-neighbour analogues, isolation-forest anomalies, random forest and gradient boosting with expanding-window tests and circular-shift null runs, permutation and SHAP importance, association rules (Apriori) mined on 2000 to 2015 and checked on 2016 to 2026.
- Limits: no causal identification; domestic flow series not available for long periods; daily data from an open archive; October 2026 partial. Code and data tables are available from Gestlat ThinkLab on request.
References
Bank of Uganda. (2017). State of the economy report, June 2017.https://archive.bou.or.ug/bou/bou-downloads/publications/StateOfEconomyReports/2017/Jun/State-of-the-Economy-Report-June-2017.pdf
Bank of Uganda. (2026). Revision of the cash reserve requirement [Circular of 15 September 2026]. https://bou.or.ug/uploads/Circular_Revision_of_the_Cash_Reserve_Requirement_15_Sept_f57d61f386.pdf
Budget Monitoring and Accountability Unit. (2016). Uganda Shilling depreciation in FY2015/16: Can a re-occurrence be mitigated? Ministry of Finance, Planning and Economic Development. https://www.finance.go.ug/sites/default/files/archive-files/Publications/BMAU%20Briefing%20Paper%2012-16%20-%20Uganda%20Shilling%20depreciation%20in%20FY2015-16.%20Can%20a%20re-occurrence%20be%20mitigated.pdf
Bwire, T., Anguyo, F. L., & Opolot, J. (2013). Exchange rate pass-through to domestic prices in Uganda: Evidence from a structural VAR.https://ideas.repec.org/a/spt/stecon/v2y2013i4f2_4_3.html
Daily Monitor. (2026). Shilling touches Shs4,500, weakest in 33 years [23 October 2026]. Daily Monitor. https://www.monitor.co.ug/uganda/news/national/shilling-touches-shs4-500-weakest-in-33-years-5643414
Electoral Commission of Uganda. (2026). Appointment of polling dates for the 2026 general elections (revised).https://ec.or.ug/sites/default/files/press/Press%20Release%20Appointment%20of%20Polling%20Dates%20for%202026%20General%20Elections%20%28Revised.7.1.26%29.pdf
fawazahmed0. (2024–2026). Open daily exchange-rate archive (@fawazahmed0/currency-api) [Data set; daily snapshots 2 March 2024 to 27 October 2026]. Validated against official monthly averages by Gestlat ThinkLab. https://github.com/fawazahmed0/exchange-api
Federal Reserve Bank of St. Louis. (n.d.). FRED: DTWEXBGS, FEDFUNDS, DGS10 [Data set]. Obtained via an open GitHub mirror (macro-financial-indicators). https://fred.stlouisfed.org/
International Monetary Fund. (n.d.). International Financial Statistics: Exchange rates (national currency per SDR and US$ per SDR, period averages) [Data set]. Via the codeforIATI open mirror. https://github.com/codeforIATI/imf-exchangerates
International Monetary Fund. (2024). Uganda: Fifth Review under the Extended Credit Facility (Country Report No. 24/77). https://imf.org/-/media/Files/Publications/CR/2024/English/1UGAEA2024001.ashx
International Monetary Fund. (2026a). Uganda: 2026 Article IV Consultation (Country Report No. 26/215). https://www.imf.org/-/media/files/publications/cr/2026/english/1ugaea2026002.pdf
International Monetary Fund. (2026b). Uganda: Selected Issues (Country Report No. 26/216). https://www.imf.org/-/media/files/publications/cr/2026/english/1ugaea2026003.pdf
Katusiime, L. (2019). Investigating spillover effects between foreign exchange rate volatility and commodity price volatility in Uganda. Economies, 7. https://doaj.org/article/9144fff19c8f403eb25c871e52d5e618
Kemoe, L., Mbohou Mama, M., Mighri, H., & Quayyum, S. (2023). African currencies are under pressure amid higher-for-longer US interest rates. IMF Blog. https://www.imf.org/en/blogs/articles/2023/05/15/african-currencies-are-under-pressure-amid-higher-for-longer-us-interest-rates
Ministry of Finance, Planning and Economic Development. (2016–2026). Performance of the economy [Monthly reports; BoU exchange rate, trade and inflation tables, 2016 to September 2026]. https://www.finance.go.ug/taxonomy/term/96/feed
Ohemeng, W., Agyapong, E. K., & Ofori-Boateng, K. (2021). Exchange rate and inflation dynamics: Does the month or quarter of the year matter? (Ghana). https://ideas.repec.org/a/spr/snbeco/v1y2021i6d10.1007_s43546-021-00074-5.html
Opolot, J., & Anguyo, F. L. (2007). Exchange rate fundamentals and dynamics in a liberalized foreign exchange market: Evidence from Uganda. Bank of Uganda. https://nru.uncst.go.ug/bitstreams/cd0f39dc-1ac0-4522-baa2-35447ba89504/download
Reuters. (2026). Uganda lifts interest rate to 12% at emergency meeting [14 October 2026]. BusinessDay. https://www.businessday.co.za/world/africa/2026-10-14-uganda-lifts-interest-rate-to-12-at-emergency-meeting/
Rio Times. (2026). Uganda shilling at 33-year low.https://www.riotimesonline.com/uganda-shilling-33-year-low-2026/
Uganda Bureau of Statistics. (2026). Consumer Price Index [Excel tables, August and September 2026 releases]. Obtained via open GitHub repositories and checked against official figures. https://www.ubos.org/publications/statistical/
United Nations Conference on Trade and Development. (2026). Trade and development foresights 2026.https://unctad.org/publication/trade-and-development-foresights-2026-global-economy-faces-geopolitical-challenge
US Energy Information Administration, CBOE, S&P Dow Jones Indices, & US Bureau of Labor Statistics. (n.d.). Brent spot (EIA), VIX (CBOE), S&P Dow Jones Indices, CPI (US BLS) [Data sets]. Via github.com/datasets open data packages. https://github.com/datasets
World Bank. (2026). World Bank commodity price data (The Pink Sheet) [Data set; monthly, updated February 2026]. Obtained via an open GitHub mirror (forex-centuries). https://www.worldbank.org/en/research/commodity-markets
About Gestlat ThinkLab. Gestlat ThinkLab is a data, technology and research consulting firm that helps businesses, development organizations and institutions make better decisions, improve operational efficiency and achieve sustainable growth by utilising data and technology.
P.O. Box 120356 Wakiso, Uganda · +256 706 107 619 · [email protected] · gestlatthinklab.com · @gestlatthinklab

Author
GestLat ThinkLab
Leave a comment
Your email address will not be published. Required fields are marked *